Process a Signal with Missing Samples
Consider the weight of a person as recorded (in pounds) during the leap year 2012. The person did not record their weight every day. You would like to study the periodicity of the signal, but before you can do so you must take care of the missing data.
Load the data and convert the measurements to kilograms. Missed readings are set toNaN. Determine how many points are missing.
load('weight2012.dat') wgt = weight2012(:,2)/2.20462; daynum = 1:length(wgt); missing = isnan(wgt); fprintf('Missing %d samples of %d\n',sum(missing),max(daynum))
Missing 27 samples of 366
Assign values to the missing points usingresample. By default,resamplemakes estimates using linear interpolation. Plot the original and interpolated readings. Zoom in on days 200 through 250, which contain about half of the missing points.
wgt_orig = wgt; wgt = resample(wgt,daynum); plot(daynum,wgt_orig,'.-',daynum,wgt,'o') xlabel('Day') ylabel('Weight (kg)') axis([200 250 73 77]) legend('Original','Interpolated') grid

Determine if the signal is periodic by analyzing it in the frequency domain. Find the cycle duration, measuring time in weeks. Subtract the mean to concentrate on fluctuations.
Fs = 7; [p,f] = pwelch(wgt-mean(wgt),[],[],[],Fs); plot(f,p) xlabel('Frequency (week^{-1})') grid

Notice how the person's weight oscillates weekly. Is there a noticeable pattern from week to week? Eliminate the last two days of the year to get 52 weeks. Reorder the measurements according to the day of the week.
wgd = reshape(wgt(1:7*52),[7 52]); plot(wgd') xlabel('Week') ylabel('Weight (kg)') dweek = datetime([repmat([2012 1],7,1) (1:7)'],'Format','eeee'); legend(string(dweek),'Location','northwest') grid

Smooth out the fluctuations using a filter that fits low-order polynomials to subsets of the data. Specifically, set it to fit cubic polynomials to sets of seven days.
wgs = sgolayfilt(wgd',3,7); plot(wgs) xlabel('Week') ylabel('Weight (kg)') title('Smoothed Weight Fluctuations') legend(string(dweek),'Location','southeast'); grid
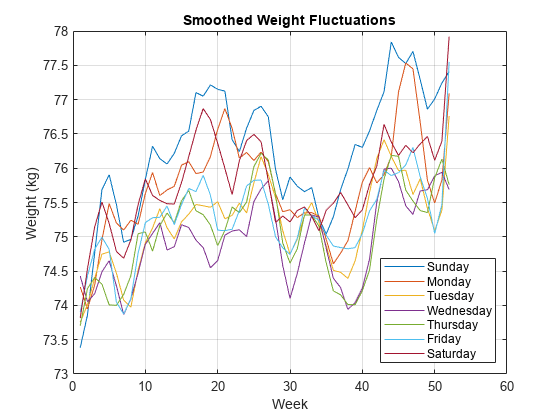
This person tends to eat more, and thus weigh more, during the weekend. Verify by computing the daily means.
forjk = 1:7 fprintf('%s mean: %5.1f kg\n',dweek(jk),mean(wgd(jk,:)))end
Sunday mean: 76.2 kg Monday mean: 75.7 kg Tuesday mean: 75.2 kg Wednesday mean: 74.9 kg Thursday mean: 75.1 kg Friday mean: 75.3 kg Saturday mean: 75.8 kg
See Also
Related Topics
Select a Web Site
Choose a web site to get translated content where available and see local events and offers. Based on your location, we recommend that you select:.
Selectweb siteYou can also select a web site from the following list:
Americas
- América Latina(Español)
- Canada(English)
- United States(English)
Europe
- Belgium(English)
- Denmark(English)
- Deutschland(德语)
- España(Español)
- Finland(English)
- France(Français)
- Ireland(English)
- Italia(Italiano)
- Luxembourg(English)
- Netherlands(English)
- Norway(English)
- Österreich(德语)
- Portugal(English)
- Sweden(English)
- Switzerland
- United Kingdom(English)
