Automating Genotoxicity Assays with Imaging Flow Cytometry and Deep Learning
斯旺西大学的保罗·里斯(Paul Rees)
遗传毒性测定法用于评估由药物等化学剂引起的遗传物质(DNA和RNA)的损害,并且通常用于测试候选药物的安全性。过去,训练有素的实验室技术人员手动进行了测定,使用显微镜检查数千个单个细胞以识别DNA损伤的生物标志物:细胞分裂时微核(MN)的形成(图1)。除了是劳动密集型和耗时的外,这种方法还取决于每个技术人员的主观判断。
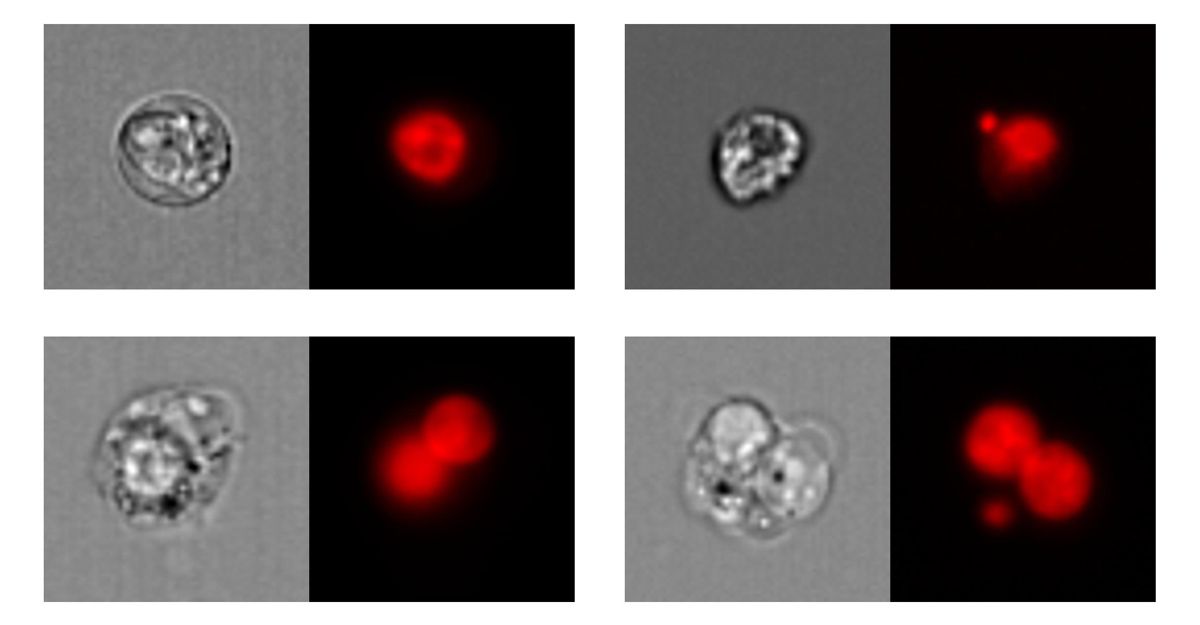
Figure 1. Top left: mononucleated cell; top right: mononucleated cell with micronucleus. Bottom left: binucleated cell; bottom right: binucleated cell with micronucleus. Left: bright-field images; right: nuclear fluorescence images.
My research group at Swansea University has developed an automated approach to genotoxicity and similar studies based on deep learning and imaging flow cytometry (IFC). My collaborator Dr. George Johnson’s lab uses an IFC to collect multichannel image data from individual cells. We use DeepFlow, a deep learning network optimized for use with IFC [1], which enables us to accurately and automatically categorize the images as single nucleus, single nucleus with MN, two nuclei, or two nuclei with MN (Figure 2).

图2.自动图像分类工作流程。
这种方法消除了手动方法的主观性,并使在世界各地的实验室中进行一致的结果,可以进行测定。因为我们在MATLAB中实现了深流®借助Deep Learning Toolbox™,我们可以将代码发送到我们合作的任何实验室,并知道它将可靠地运行。许多研究人员已经熟悉MATLAB,这意味着他们可以轻松地修改或改进代码,并根据其特定的实验设置量身定制深色。
Building DeepFlow
我们最初使用keras tensorflow™实现了DeepFlow,但决定在MATLAB中重新实现它,以便在世界上几乎任何实验室中都可以使用DeepFlow。无论特定实验室正在使用什么流式细胞仪机,我们都希望我们的软件能够工作。我们不想担心依赖关系,我们想要一个易于理解和修改的深度学习网络。
Rather than performing a line-for-line translation of our Keras code, we used the Deep Network Designer app to build, visualize, and train the DeepFlow network. With the Keras code up on one side of the screen and the Deep Network Designer app on the other, we simply replicated the architecture of the initial implementation (Figure 3).

图3. Deep Network Designer应用程序中的DeepFlow网络。
我们使用网络analyzer in Deep Learning Toolbox to check for errors in the network and its layers (Figure 4). For example, we started with a network designed for images of 200x200 pixels and downsized it to work with the 64x64-pixel images that we get from the IFC, using the network analyzer to verify the image size at each convolutional layer in the network. Our collaborators also use the network analyzer when they make changes to the network with the Deep Network Designer app.
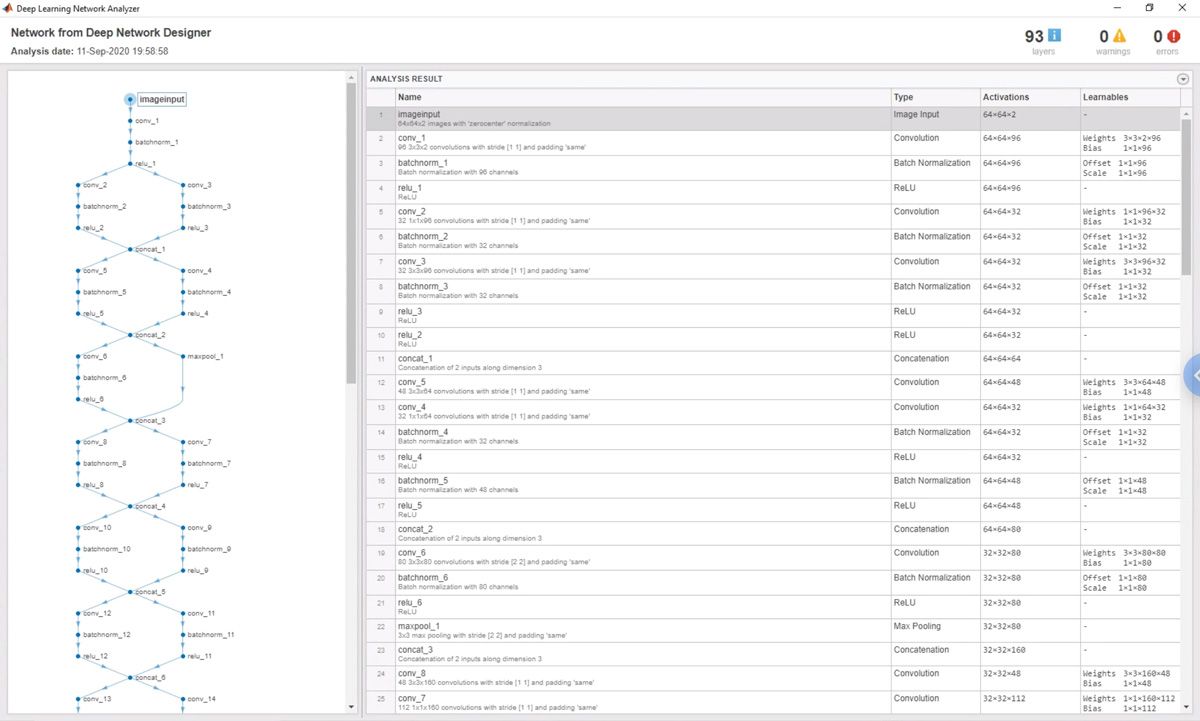
图4. MATLAB网络分析仪应用程序中的深流网络。
在遗传毒性测定中使用深流
In our experimental setup, we use an IFC capable of processing 10,000 cells within minutes. We capture bright-field images as well as fluorescence images of nuclei and micronuclei stained with a solution that makes the DNA more visible (Figure 5).
![图5.用于分类和可视化IFC数据的CNN。[1]](http://www.tatmou.com/jp/company/newsletters/articles/automating-genotoxicity-assays-with-imaging-flow-cytometry-and-deep-learning/_jcr_content/mainParsys/image_0_copy_copy_co_452274873.adapt.full.medium.jpg/1600960838691.jpg)
图5.用于分类和可视化IFC数据的CNN。[1]
我们将IFC数据作为MATLAB数据存储带入MATLAB。我们使用传统的图像处理技术进行预处理,以根据其强度重新构成每个图像,并确保每个图像都焦点,并且单元格完全在框架中。我们使用边缘检测来识别表明图像焦点和完美平坦的边缘的干净边缘,这表明相机尚未捕获整个单元格。
We trained the DeepFlow CNN on more than 2000 manually classified images. Once we have a normalized, clean set of data from the IFC, we use the trained network to classify images as having mono-, bi-, tri-, or tetra-nucleated cells with or without MN. Finally, using a well-established formula that calculates the percentage of cells falling into each category, we can assess the toxicity of the agent used to treat the cells.
我们发现,DeepFlow网络中最终分类层上方的层对于了解训练有素的CNN的工作方式特别有价值。为了解析该层中嵌入的信息,我们使用MATLAB应用t- 用于可视化高维数据的随机邻居嵌入(TSNE)算法(图6)。这些可视化可以揭示在手动检查中几乎看不到的图像数据中的细微差别。例如,分类为二核细胞和单核与微核的细胞之间的关系表明,大小决定了正常核与微核的差异。

图6.数据可视化数据,显示了来自遗传毒性测定法的典型细胞类型。
使用薄弱的监督学习将深流原理扩展到血质质量评估
In addition to the genotoxicity study, we’ve used deep learning in a variety of analysis and classification applications. Recently, for example, my colleagues and I used a CNN and weakly supervised learning to study the degradation of red blood cells (RBCs) over time [2]. RBCs in blood stored for transfusions develop storage lesions, observed as changes in cell morphology, which are often assessed manually with a microscope. Manual assessment is incredibly time-consuming, and we noticed that different experts often produced different scores.
在加拿大皇家银行研究的第一部分中,我们像遗传毒性研究一样进行,训练CNN的图像被手动标记为属于几种可能的形态之一,or phenotypes(Figure 7). The trained network achieved greater than 76% agreement with an expert in classifying the morphologies, which is comparable to the approximately 79% agreement seen between experts.
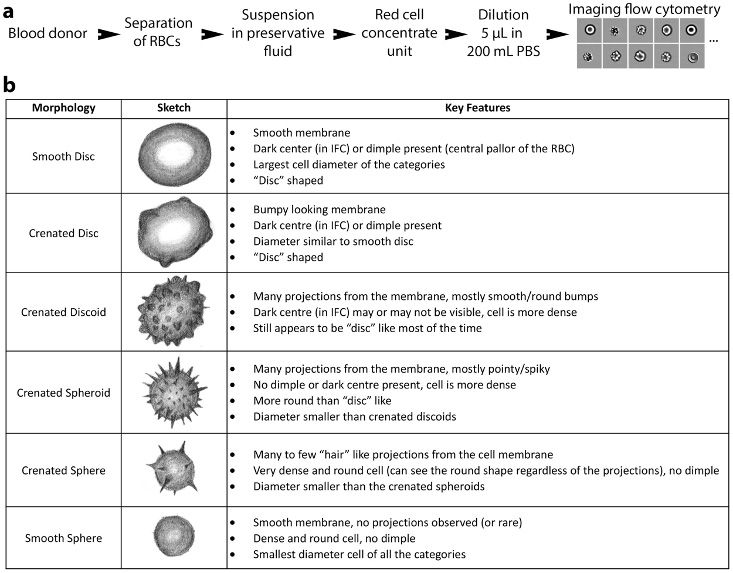
图7. RBC形态。
在研究的第二部分中,我们消除了主观的人类标签,并仅使用血液存储的时间培训了一个弱监督的神经网络RESNET50。当我们使用遗传毒性研究中使用的基于TSNE的技术可视化结果时,我们发现该网络学会了提取单细胞特征,这些特征揭示了形态变化的时间顺序进展(图8)。我们意识到,这种进展可用于预测血质和储存的血液的到期日期,而无需进行人类策划的注释,减少了血液浪费并有助于确保在输血中不使用不合适的血液。

图8. CNN可视化期间揭示的表型(形态)的分布。
Plans for DeepFlow
我们的小组目前正在评估几个潜在的研究项目,这些研究项目将IFC和深度学习与MATLAB结合在一起。一个项目基于遗传毒性研究,但重点是评估接受化疗的患者中白细胞的反应[3]。第二个将扩展到幻灯片扫描分析,这有可能使公司能够重新分析大量的幻灯片扫描数据。我们还正在开发一个用于DeepFlow的图形接口,我们将将其作为单个独立应用程序包装。
出版于2020年
参考
-
[1]Eulenberg, P., Köhler, N., Blasi, T.等。“使用深度学习重建细胞周期和疾病进展。”Nature Communications8,463(2017)。doi:10.1038/S41467-017-00623-3
-
[2] Doan, M,塞巴斯蒂安,jet. al.“通过深度学习对存储的血质的客观评估。”美国国家科学院论文集Sep 2020, 117 (35) 21381-21390. doi:10.1073/pnas.2001227117
-
[3] Doan,M.,Case,M.,Masic,D.,Hennig,H.,McQuin,C.,Caicedo,J.,Singh,S.,Goodman,A.,Wolkenhauer,O。,Summers,Summers,H.D.,Jamieson,D.,Van Delft,F.W.,Filby,A.,Carpenter,A.E.,Rees,P。和Irving,J。(2020)。“通过计算机视觉监测无标签的白血病。”细胞仪, 97: 407-414. doi:10.1002/cyto.A.23987