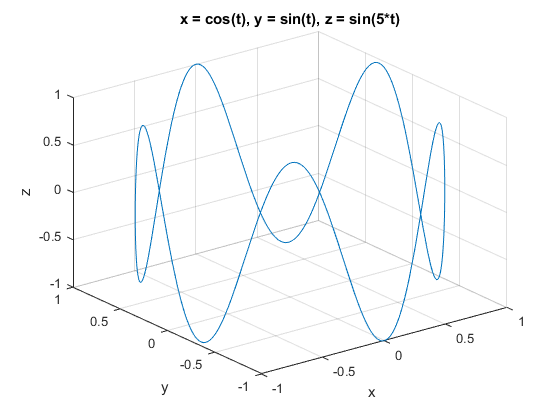
这是如何从Matlab®中的函数创建3D线图的示例。
读取Matlab文档中的“fplot3”功能。此功能可在R2016A或更新中提供。
有关详细信息,请转到Matlab Plot Gallery -//www.tatmou.com/discovery/gallery.html.
引用
Mathworks Plot Gallery团队(2021)。Matlab Plot Gallery - 功能绘图3D(//www.tatmou.com/matlabcentral/fileexchange/35263-matlab-plot-gallery-function-plot-3d),matlab中央文件exchange。检索到。