MATLAB Plot Gallery - Graph Plot
version 1.1.0.2 (24.8 KB) by
MathWorks Plot Gallery Team
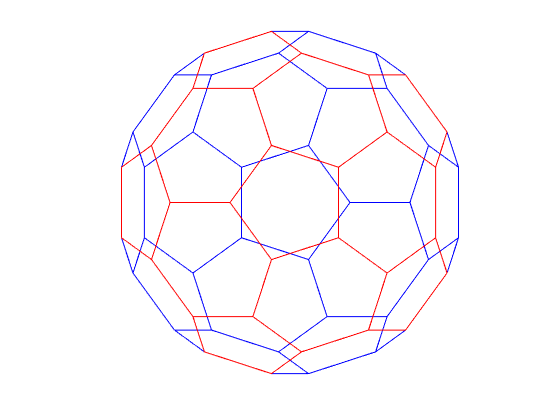
Create a graph plot
This is an example of how to create a graph plot in MATLAB®.
Read about the "gplot" function in the MATLAB documentation.
For more examples, go to MATLAB Plot Gallery -//www.tatmou.com/discovery/gallery.html
Cite As
MathWorks Plot Gallery Team (2021).MATLAB Plot Gallery - Graph Plot(//www.tatmou.com/matlabcentral/fileexchange/35292-matlab-plot-gallery-graph-plot), MATLAB Central File Exchange. Retrieved.
MATLAB Release Compatibility
Created with R2014b
Compatible with any release
Platform Compatibility
Windows macOS LinuxCategories
Tags
Acknowledgements
Inspired:gplot3: plotting simple graphs in 3d
Community Treasure Hunt
Find the treasures in MATLAB Central and discover how the community can help you!
Start Hunting!Discover Live Editor
Create scripts with code, output, and formatted text in a single executable document.