The Smith Chart Circles Toolbox 2
A MATLAB toolbox for plotting Smith Chart Circles and points of interest on the Smith Chart. It also includes functions to calculate important parameters when designing discrete transistor RF amplifiers.
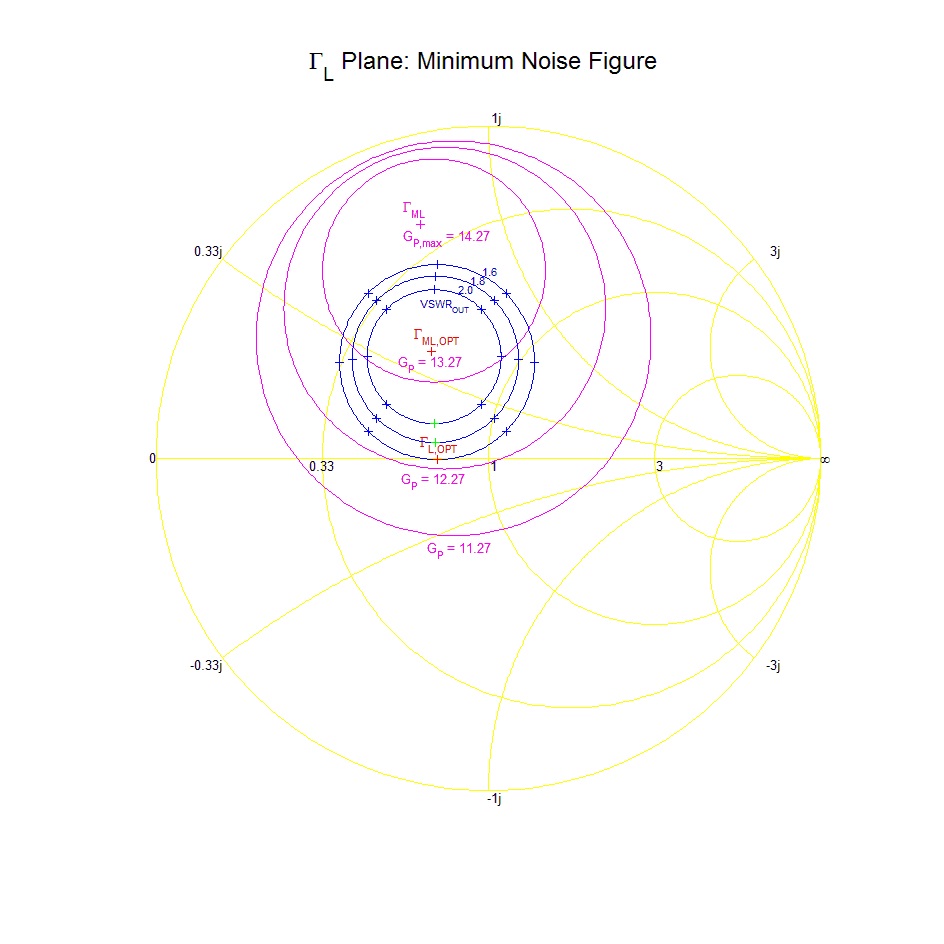
Example:
Also includes a design example and a paper written using the toolbox. The plots generated by the tool are used on the second page of the paper.
Documentation:
There are a few undocumented functions, but most of the functionality is documented and most users should be able to figure out the rest.
Equations based on:
G. Gonzalez, "Microwave Transistor Amplifiers - Analysis and Design," 2nd ed., Prentice Hall, 1997.
Cite As
Curtis (2022).The Smith Chart Circles Toolbox 2(https://github.com/curtisma/MATLAB_smith_circles_2), GitHub. Retrieved.
MATLAB Release Compatibility
Platform Compatibility
Windows macOS LinuxTags
Acknowledgements
Inspired by:The Smith Chart Circles Toolbox
Community Treasure Hunt
Find the treasures in MATLAB Central and discover how the community can help you!
Start Hunting!Discover Live Editor
Create scripts with code, output, and formatted text in a single executable document.
You can also select a web site from the following list:
Americas
- América Latina(Español)
- Canada(English)
- United States(English)
Europe
- Belgium(English)
- Denmark(English)
- Deutschland(Deutsch)
- España(Español)
- Finland(English)
- France(Français)
- Ireland(English)
- Italia(Italiano)
- Luxembourg(English)
- Netherlands(English)
- Norway(English)
- Österreich(Deutsch)
- Portugal(English)
- Sweden(English)
- Switzerland
- United Kingdom(English)
Asia Pacific
- Australia(English)
- India(English)
- New Zealand(English)
- 中国
- 日本Japanese(日本語)
- 한국Korean(한국어)