
Converts 3D and 2D MATLAB plots to the scalable vector format (SVG).

Short code to create shading around a mean. Input is a matrix with rows of observations.

Create pretty shaded plots and plots to visualize the statistical distribution of data.

Remove shading (or the un-even intensity background) of images

Function shades the area between two vectors.

Create shades of colors and colormaps

Plot two lines, then shade the area between those two lines.

The fills in graphs above and below the x-axis different colors.
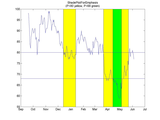
Plots a shaded bar for emphasis as commonly seen on economic charts.

like errorbar, but in 2D and fills an area rather than plotting bars
You can also select a web site from the following list:
Americas
- América Latina(Español)
- Canada(English)
- United States(English)
Europe
- Belgium(English)
- Denmark(English)
- Deutschland(Deutsch)
- España(Español)
- Finland(English)
- France(Français)
- Ireland(English)
- Italia(Italiano)
- Luxembourg(English)
- Netherlands(English)
- Norway(English)
- Österreich(Deutsch)
- Portugal(English)
- Sweden(English)
- Switzerland
- United Kingdom(English)
Asia Pacific
- Australia(English)
- India(English)
- New Zealand(English)
- 中国
- 日本Japanese(日本語)
- 한국Korean(한국어)