bordersmdocumentation
bordersmplots National or US state boundaries on maps generated with Matlab's Mapping Toolbox. If you don't have Matlab's Mapping Toolbox, usebordersinstead.
Data are compiled from2013 US Census Bureau 500k dataand athematicmapping.org TM World Borders 0.3dataset.
Back to Climate Data Tools Contents
Contents
Syntax
bordersm bordersm(place) bordersm(...,LineProperty,LineValue) bordersm(...,PatchProperty,PatchValue) h = bordersm(...) [lat,lon] = bordersm(place)
Description
bordersmplots national bordersm on a map.
bordersm(place)plots the bordersm of aplace, which can be any country or US state.placemay also be'countries'to plot all national bordersm,'states'to plot all US state bordersm, or'Continental US'to plot only the continental United States (sorry Guam). Note: to plot the nation of Georgia, use'Georgia'. To plot the US state of Georgia, specify'Georgia.'with a period.
bordersm(...,LineProperty,LineValue)specifies linestyle or markerstyle.
bordersm(...,PatchProperty,PatchValue)outlines states or nations as patch objects if any property begins with'face', (e.g.,'facecolor','red'). Note that plotting all countries as patches can be a bit slow.
h = bordersm(...)returns a handlehof plotted object(s).
[lat,lon] = bordersm(place)does not plot any bordersm, but returns arrays of their geographic coordinates.
Example 1: Very simple
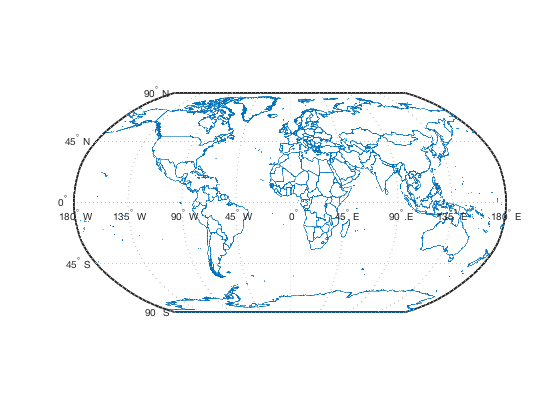
To plot all national bordersm, just typebordersm:
bordersm
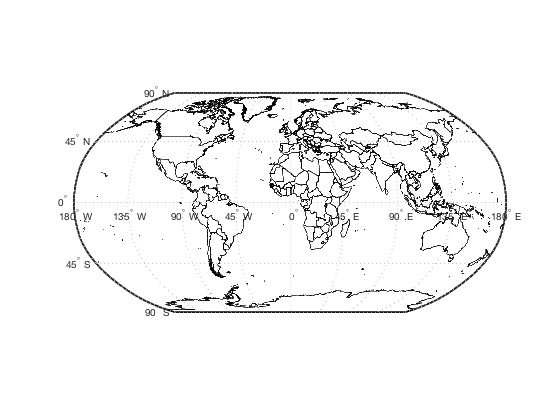
Or specify line properties like this (this makes country outlines black):
bordersm('countries','k')
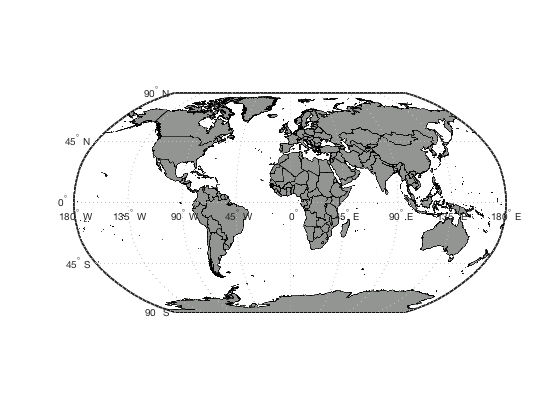
Specifying facecolor or other patch properties switches from line plotting to patch object plotting.
bordersm('countries','facecolor',rgb('gray'))
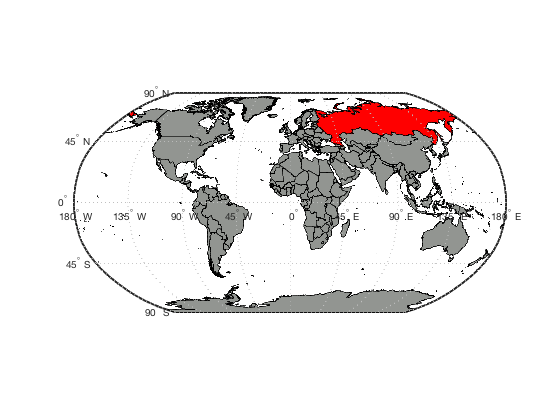
示例2:红色的俄罗斯,红色Russia
To plot just one country, specify its name like this. Add Russia to the map as a big red patch:
bordersm('russia','facecolor','red')
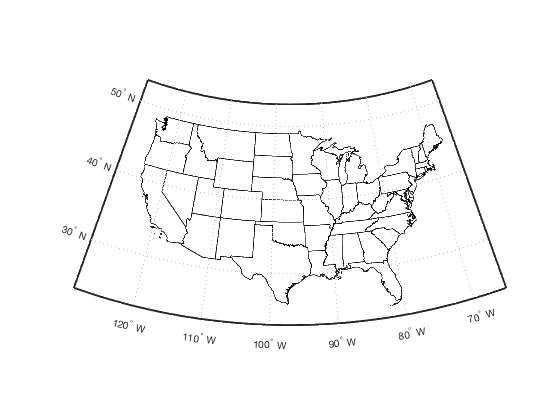
Example 3: Continental US
Open a new figure and plot the continental United States oulined in black:
figure bordersm('continental us','k')
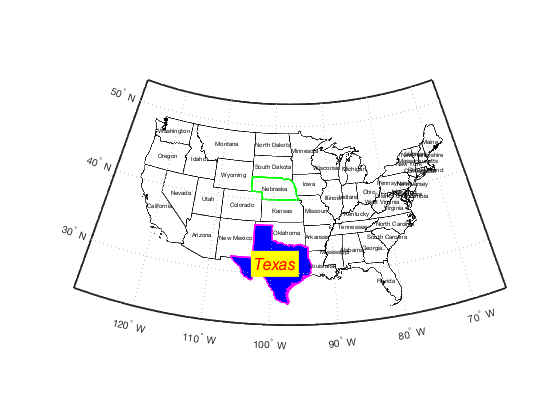
Example 4: Fancy formatting
Let's turn Texas blue (Beto couldn't do it, but we sure can), give it a thick magenta outline, and give Nebraska a thick green outline. Thelabelbordersmfunction works just like thebordersmfunction.
bordersm('texas','facecolor','blue','edgecolor','m','linewidth',2) bordersm('nebraska','g','linewidth',2) labelbordersm('continental us','fontsize',6); labelbordersm('Texas','color','r','backgroundcolor','y',...'fontangle','italic','fontsize',16)
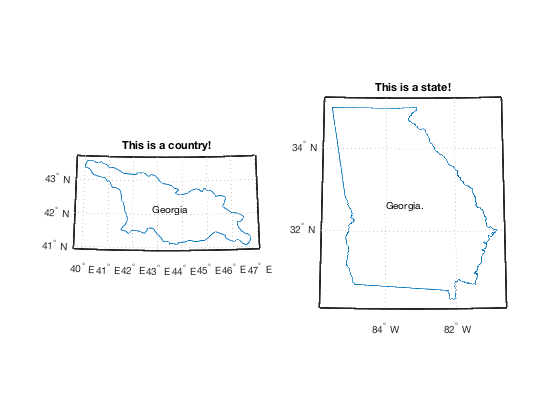
Example 5: Georgia vs. Georgia.
There are two Georgias. To distinguish between them, I've placed a period at the end of the US state called Georgia. Let us compare:
figure subplot(121) bordersm'georgia'labelbordersm'Georgia'title'This is a country!'subplot(122) bordersm'georgia.'labelbordersm'Georgia.'title'This is a state!'
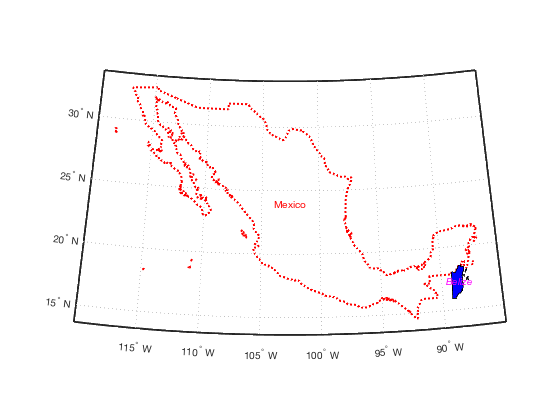
Example 6: More types of formatting
figure bordersm('mexico','r:','linewidth',2) holdonbordersm('belize','facecolor','b','linestyle','-','linewidth',1) labelbordersm('Mexico','color','r') labelbordersm('Belize','color','m','fontangle','italic')
Author Info
Thebordersmandlabelbordersmfunctions were written byChad A. Greeneof the University of Texas at Austin's Institute for Geophysics (UTIG), April 2015. % This function is part of theClimate Data Toolbox for Matlab.