cdtgriddocumentation
Thecdtgridfunction usesmeshgridto easily create a global grid of latitudes and longitudes.
Back to Climate Data Tools Contents
Contents
Syntax
[lat,lon] = cdtgrid [lat,lon] = cdtgrid(res) [lat,lon] = cdtgrid([latres lonres]) [lat,lon] = cdtgrid(...,centerLon)
Description
[lat,lon] = cdtgridgenerates a meshgrid-style global grid of latitude and longitude values at a resolution of 1 degree. Postings are centered in the middle of grid cells, so a 1 degree resolution grid will have latitude values of 89.5, 88.5, 87.5, etc.
[lat,lon] = cdtgrid(res)specifies grid resolutionres, whereresis a scalar and specifies degrees. Defaultresis1.
[lat,lon] = cdtgrid([latres lonres])ifresis a two-element array, the first element specifies latitude resolution and the second element specifies longitude resolution.
[lat,lon] = cdtgrid(...,centerLon)centers the grid on longitude valuecenterLon. DefaultcenterLonis the Prime Meridian (0degrees).
Example 1: Real simple
Here's a 1-degree global grid:
(纬度、经度)= cdtgrid;情节(经度、纬度、“b”。) xlabel('longitude') ylabel('latitude')
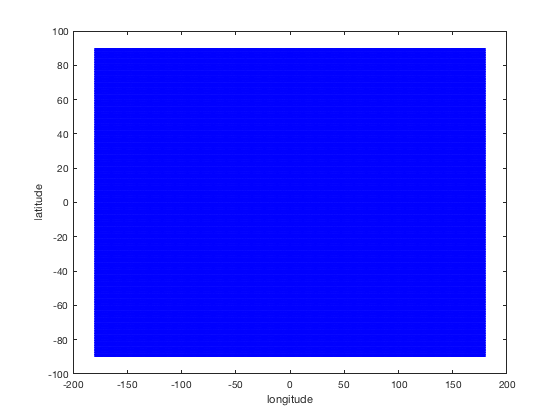
Above, it looks like a big blue rectangle, but zoom in and you'll see that it's actually 180 * 360 = 64,800 blue dots.
Example 2: More complicated
Now overlay a grid that has 10 degree latitude resolution and 15 degree longitude resolution, centered on 180°E. Plot the new grid as red circles to distinguish them from the blue dots:
[lat2,lon2] = cdtgrid([10 15],180); holdonplot(lon2,lat2,'ro')
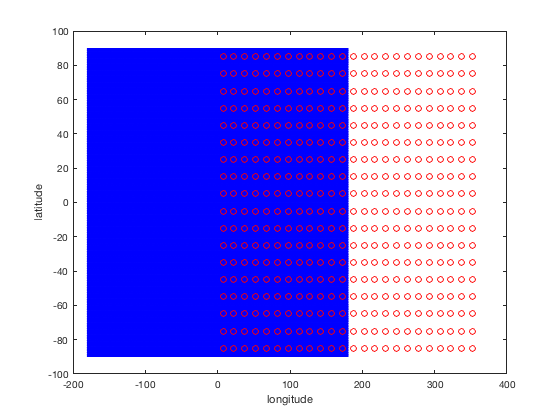
The two grids do not line up with each other because we intentionally ensured that the second grid would be centered on 180°E. Use the重定位function to move them back over if you'd like:
[lat2_rc,lon2_rc] = recenter(lat2,lon2); plot(lon2_rc,lat2_rc,'kx')

Author Info
Thecdtgridfunction and supporting documentation were written byChad A. Greeneof the University of Texas at Austin, Institute for Geophysics (UTIG), February 2017.