ntitledocumentation
ntitle地方一个标题在一个阴谋,而不是最重要的it.
Back to Climate Data Tools Contents.
Contents
Syntax
ntitle(txt) ntitle(...,'location',InsetLocation) ntitle(...,Name,Value) ntitle(...,'pad',false) h = ntitle(...)
Description
ntitle(txt)adds the specified titletxtto the current axes.
ntitle(...,'location',InsetLocation)sets the title location as
- 'north'(default)
- 'northwest'or'nw'upper left
- 'northeast'or'ne'upper right
- 'east'or'e'left
- 'center'or'c'middle
- 'west'or'w'right
- 'southwest'or'sw'lower left
- 'south'or's'bottom center
- 'southeast'or'sw'lower right
ntitle(...,Name,Value)specifies any text properties such as color, fontsize, etc.
ntitle(...,'pad',false)turns off the default behavior of offsetting text from each side by one space. By default, one space is placed between axis edges and text.
h = ntitle(...)returns a handlehof the title text.
Example 1
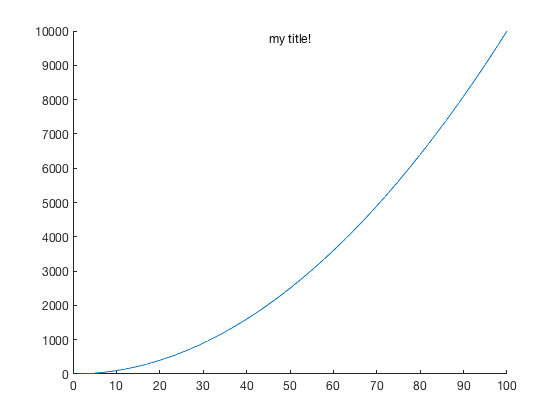
Make a simple plot and title it:
plot((1:100).^2) boxoffntitle'my title!'
Example 2
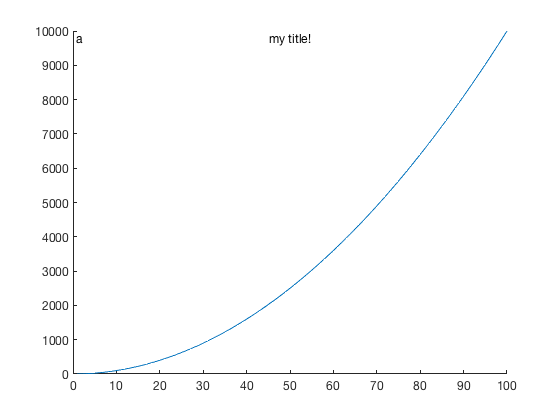
Here's a letter a. just like you'd see when multiple panels in a published figure are labeled with letters:
ntitle('a','location','nw')
Example 3:
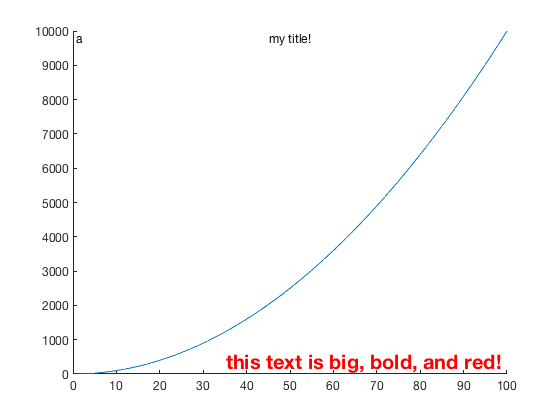
Place large, bold red text in the bottom right corner:
ntitle('this text is big, bold, and red!',...'location','se',...'color','r',...'fontweight','bold',...'fontsize',20)
Author Info
This function is part of theClimate Data Toolbox for Matlab. The function and supporting documentation were written by Chad A. Greene of the University of Texas at Austin.