xyz2griddocumentation
xyz2gridconverts regularly-spaced columnated x,y,z data into gridded data. See alsoxyzread.
Back to Climate Data Tools Contents
Contents
Syntax
Z = xyz2grid(x,y,z) Z = xyz2grid(filename) Z = xyz2grid(filename,Name,Value) [X,Y,Z] = xyz2grid(...)
Description
Z = xyz2grid(x,y,z)assumes x and y have some form of regularity and puts the corresponding values ofzinto a regular 2D MxN gridded matrixZ.
Z = xyz2grid(filename)loads data from a .xyz file of three columns (x, y, and z) then puts the data into a grid. This function assumes the input x,y,z data have some gridded regularity, but may have some missing data points.
Z = xyz2grid(filename,Name,Value)opens a .xyz file with anytextscanoptionsName,Value, for example,'headerlines',1.
[X,Y,Z] = xyz2grid(...)returns 2D meshgriddedXandYmatrices corresponding to the values inZ.
Example 1
You may have some columns of x,y, and z values that look like this:
x = [1 1 2 2 2 3 3]; y = [1 2 1 2 3 1 3]; z = [1 2 4 5 6 7 9]; scatter(x,y,500,z,'filled') axis([0 4 0 4]) colorbar
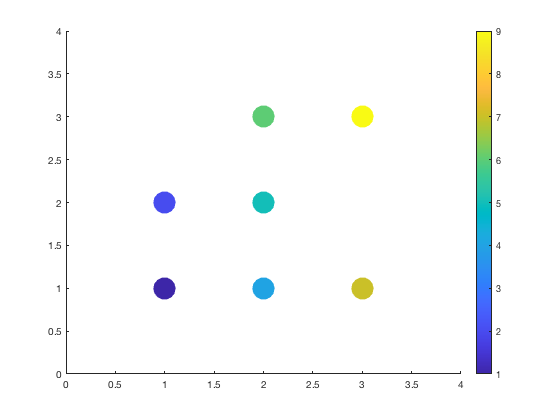
从上面的散点图中,你可以看到that there is some gridded regularity to the data, even though a couple of spots in the grid are missing. That's okay. Let's grid it up:
[X,Y,Z] = xyz2grid(x,y,z)
X = 1 2 3 1 2 3 1 2 3 Y = 3 3 3 2 2 2 1 1 1 Z = NaN 6 9 2 5 NaN 1 4 7
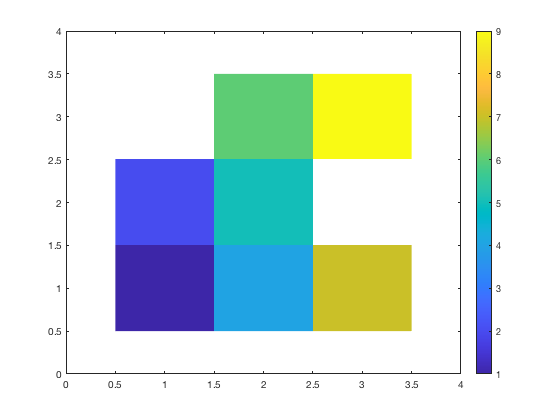
You can see the two missing values are filled byNaN. You can plot the gridded data withsurf(X,Y,Z)orpcolor(X,Y,Z), but let's useimagescninstead:
imagescn(X,Y,Z) axis([0 4 0 4]) colorbar
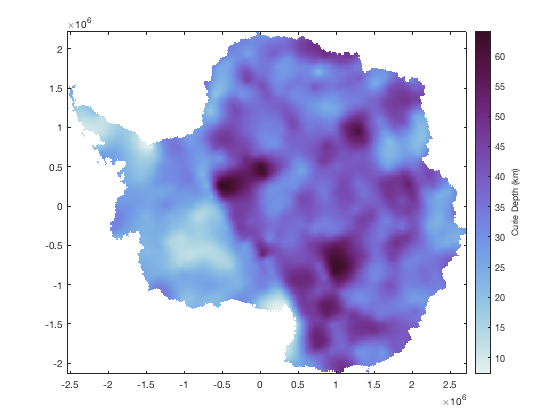
Example 2: Antarctic Curie Depth
For this example, use load and plot Antarctic Curie depth data fromMartos 2017:
[X,Y,CD] = xyz2grid('Curie_Depth.xyz'); figure imagescn(X,Y,CD) cmoceandensecb = colorbar; ylabel(cb,'Curie Depth (km)')
Author Info
This function is part of theClimate Data Toolbox for Matlab. The function and supporting documentation were written by Chad A. Greene of the University of Texas at Austin.