App with Auto-Reflow That Updates Plot Based on User Selections
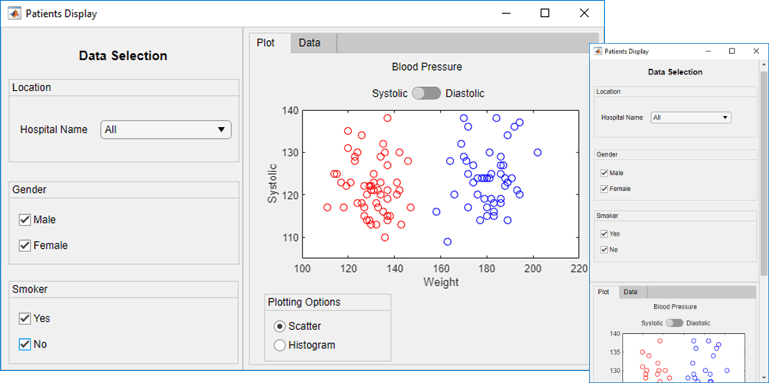
This app shows how to define controls and tabs within the panels of an app with auto-reflow. The controls are in an anchored panel on the left. The right panel that reflows contains two tabs. One tab displays a chart and user interface components for adjusting the chart. The other tab contains a table with the data used to make the chart. User selections update both the plot and the table. The app responds to resizing by automatically growing, shrinking, and reflowing the app content.
The app includes these components:
Check boxes — used to update the plot and table when the user selects or clears a check box.
Switch — used to toggle the data that is visualized in the chart
Button group containing radio buttons — used to manage exclusive selection of radio buttons. When the user selects a radio button, the button group executes a callback function to update the plot with the appropriate data.
Slider — used to adjust histogram bin width. This slider only appears when the柱状图plotting option is selected in the button group.
Table — used to view the data associated with the chart.
See Also
UIAxes Properties|Table Properties
Related Topics
You can also select a web site from the following list:
Americas
- América Latina(Español)
- Canada(English)
- United States(English)
Europe
- Belgium(English)
- Denmark(English)
- Deutschland(Deutsch)
- España(Español)
- Finland(English)
- France(Français)
- Ireland(English)
- Italia(Italiano)
- Luxembourg(English)
- Netherlands(English)
- Norway(English)
- Österreich(Deutsch)
- Portugal(English)
- Sweden(English)
- Switzerland
- United Kingdom(English)