Linearize at Simulation Snapshot
This example shows how to use theModel Linearizerto linearize a model by simulating the model and extracting the state and input levels of the system at specified simulation times.
To linearize your model at the command line, use thelinearizefunction.
Open the Simulink®model.
sys ='watertank'; open_system(sys)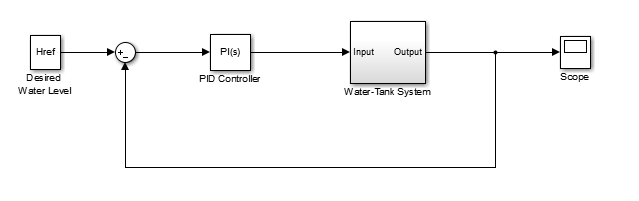
Open theModel Linearizerfor the model.
In the Simulink model window, in theAppsgallery, clickModel Linearizer.
To specify linearization input and output points, open theLinearizationtab. To do so, in theAppsgallery, click线性化管理.
To specify an analysis point for a signal, click the signal in the model. Then, on theLinearizationtab, in theInsert Analysis Pointsgallery, select the type of analysis point.
Configure the output signal of thePID Controllerblock as anInput Perturbation.
Configure the output signal of theWater-Tank Systemblock as anOpen-loop Output.
Create a new simulation-snapshot operating point at which to linearize the model. In theModel Linearizer, in theOperating Pointdrop-down list, selectTake simulation snapshot.
In the Enter snapshot times to linearize dialog box, in theSimulation Snapshot Timesfield, enter one or more snapshot times at which to linearize. For this example, enter
10to extract the operating point at this simulation time.
Tip
To linearize the model at several operating points, specify a vector of simulation times in theSimulation Snapshot Timesfield. For example, entering
[1 10]results in an array of two linear models, one linearized att = 1and the other att = 10.Generate the simulation-snapshot operating point. ClickTake Snapshots.
The operating point
op_snapshot1appears in the Linear Analysis Workspace. In theOperating Pointdrop-down list, this operating point is now selected as the operating point to be used for linearization.Linearize the model at the specified operating point and generate a bode plot of the result.
Click
 Bode. The Bode plot of the linearized plant appears, and the linearized plant
linsys1appears in the Linear Analysis Workspace.
Double click
linsys1in theLinear Analysis Workspaceto see the state space representation of the linear model. Right-click on the plot and select information from theCharacteristicsmenu to examine characteristics of the linearized response.Close Simulink model.
bdclose(sys);


Related Topics
You can also select a web site from the following list:
Americas
- América Latina(Español)
- Canada(English)
- United States(English)
Europe
- Belgium(English)
- Denmark(English)
- Deutschland(Deutsch)
- España(Español)
- Finland(English)
- France(Français)
- Ireland(English)
- Italia(Italiano)
- Luxembourg(English)
- Netherlands(English)
- Norway(English)
- Österreich(Deutsch)
- Portugal(English)
- Sweden(English)
- Switzerland
- United Kingdom(English)