Timetables in Finance
Timetables, date transformations and merges, chart technical indicators
Use timetable analysis capabilities to forecast market volatility, analyze correlation in data series, test hypotheses about market dynamics, and build models for further analysis. Working with timetables for finance, you can access, visualize, and analyze historic and livetimetabledata. For information on converting from a financial time series object (弗林特) to a MATLAB®timetable, seeConvert Financial Time Series Objects fints to Timetables.
Frequently Viewed Topics
Categories
- Create Timetables for Finance
Create atimetablewith financial data - Common Operations with Timetables for Finance
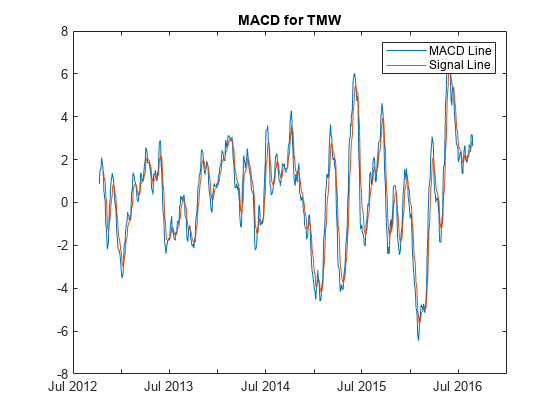
Clean data, resample and aggregate data, combine timetables and synchronize dates - Chart Technical Indicators
Chart technical indicators for price, direction, and volume in a matrix,table, ortimetable - Chart Financial Data
Charting options for financial data input using timetables or tables
Featured Examples
You can also select a web site from the following list:
Americas
- América Latina(Español)
- Canada(English)
- United States(English)
Europe
- Belgium(English)
- Denmark(English)
- Deutschland(Deutsch)
- España(Español)
- Finland(English)
- France(Français)
- Ireland(English)
- Italia(Italiano)
- Luxembourg(English)
- Netherlands(English)
- Norway(English)
- Österreich(Deutsch)
- Portugal(English)
- Sweden(English)
- Switzerland
- United Kingdom(English)