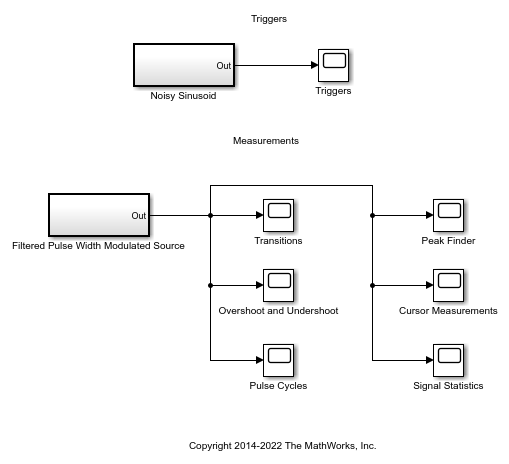
Time Scope Measurements
This example shows how to measure performance characteristics of a pulse width modulated sinusoid. The example contains a model which you can modify to view the effects of parameter changes on rise time, fall time, overshoot, undershoot, pulse width, pulse period, and duty cycle measurements. The example also shows an example of a rising edge trigger and is set up to perform basic statistical operations (mean, median, RMS, maximum, minimum) and measure the frequency and period of the pulse period via cursors and peak finding.
The example model contains several measurements and their corresponding setups.
触发器
第一部分显示了如何使用触发器来稳定显示屏中的嘈杂正弦。您可以看到正弦曲线是如何通过在嘈杂的正弦曲线上双击来构建的。
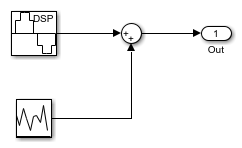
The sinusoidal signal is fed into a Time Scope block with triggers enabled.
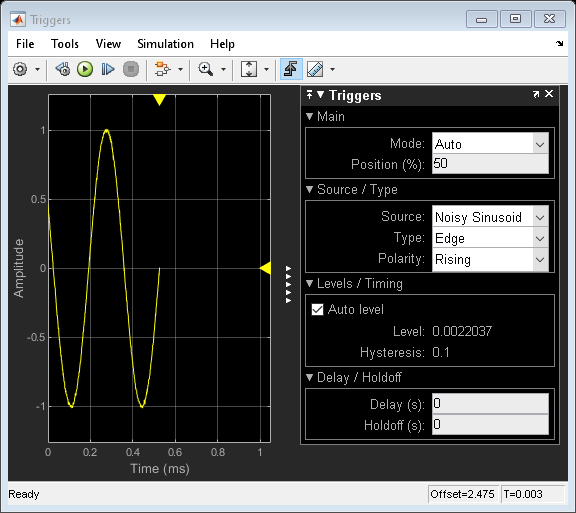
您可以通过将标记在显示屏上拖动标记来实验触发位置。您可以在上升或跌落时触发。该示例包括0.1 V的滞后,以帮助在存在噪声的情况下稳定正弦。磁滞可确保信号在注册正进行过渡之前至少低于触发水平的0.1 V。
If you close the triggers, you will see that the sinusoid no longer stays fixed in the screen. You can bring the triggers back by clicking on the trigger icon.
Measurements of a Pulse Width Modulated Source
在此示例中,脉冲宽度调制源连接到包含测量值的几个时间范围。
You can view the source by clicking on it:
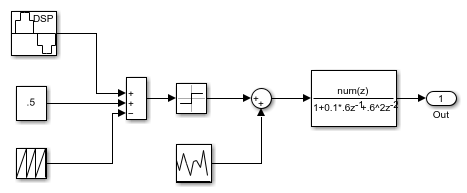
The model constructs sinusoidal pulse width modulation by applying a bias to the desired sine wave and subsequently subtracting a periodic sawtooth wave. The resulting waveform is then fed into a comparator to form the shape of the pulse. Noise is then added to the signal and then sent to a filter with an underdamped response.
您可以通过单击随机源并修改高斯分布的方差来修改输入上的添加噪声量。
You can similarly modify the response of the filter by changing its coefficients.
转换
您可以通过查看“ Bilevel测量”对话框的过渡面板来查看有关波形的上升和下降过渡的一些基本信息。
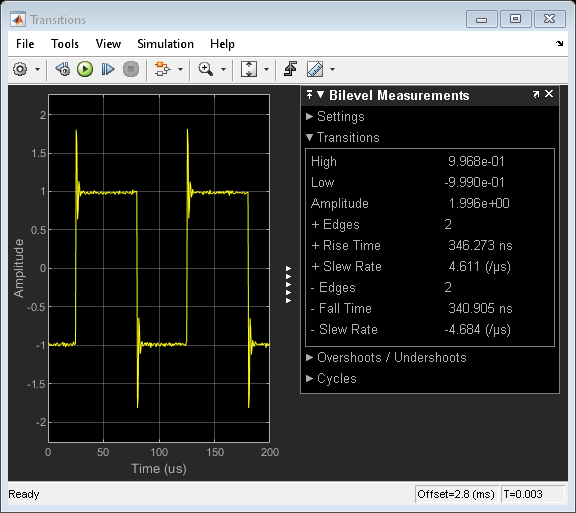
Viewing the results, you can see that the pulse has a high voltage level of +1 V and a low voltage level of -1 V.
The example above captures two rising (positive) edges and two falling (negative) edges with rise times and fall times of around 340 ns. If you zoom into just one edge of the waveform you can see the measurements for just that edge.
请注意,脉冲的边缘相当陡峭,其振荡速率约为4 v/us。使用不足的过滤器来达到此速率。更改要过度阻尼的过滤器将降低每个脉冲边缘在脉冲水平之间过渡的速率。在低状态和高状态之间变化后,不受干扰的过滤器的输出立即表现出明显的铃声。为了量化这种响铃行为,您可以在“超声 /下方”面板中使用测量值。
超冲和奔跑
The Bilevel Measurements dialog also contains measurements that relate to an under-damped environment. You can view the transition aberrations by opening the Overshoots / Undershoots panel:

上升边缘的平均超冲压约为42%。下跌是34%。大型过冲线有时会损坏逻辑设备,这些设备旨在仅接受一个小电压范围。大型不足会导致设备检测不正确的逻辑状态。在此示例中,过渡平均在7.3微秒内定居。
您可以通过在调制源的输出处使用过滤器系数来减少振铃量。
Pulse Cycles
您还可以通过打开“双光线测量”对话框中的周期面板来查看脉冲宽度和占空比如何随时间的函数而变化:

This example shows three positive-polarity pulses but only two negative-polarity pulses. The pulse frequency is 10 kHz. You can observe the encoded sinusoid by watching how the duty cycle and pulse width change over time.
Peak Finder
另外,您可以通过调用峰查找器对话框来测量幅度和显着峰值的时间。

The voltage at the tip of each overshoot is about 1.8 V and the next largest ringing component of the first pulse is at 1.14 V.
Expand the settings panel to change the number of peaks shown. You can also filter based on height or distance between peaks. You can also change the text annotation shown in the display.
Cursor Measurements
您可以使用光标测量值测量波形事件之间的相对距离。这里的光标处于每个脉冲的开始,并确认脉冲周期为10 kHz。

Experiment with the settings to move the cursors anywhere on the screen or measure the locations of other signals. You can move the cursors with the arrow keys and also snap them to either the nearest data point or screen pixel.
年代ignal Statistics
You can view basic signal statistics of the captured wave with the Signals Statistics measurement dialog.
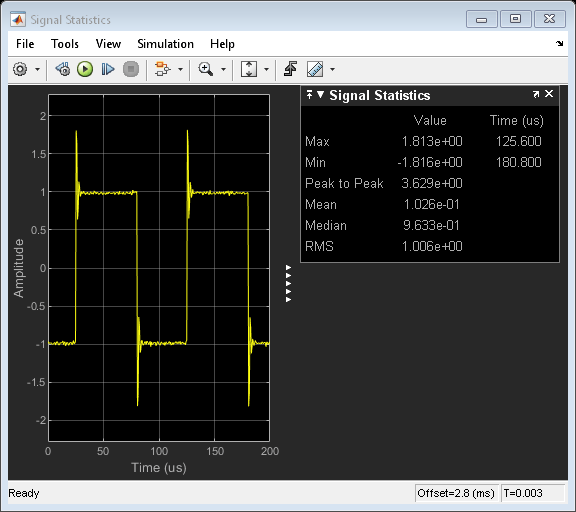
You can observe the minimum and maximum values of the displayed signal and other signal metrics, such as the peak-to-peak, mean, median, and RMS values.
参考
IEEE Std. 181-2003 IEEE Standard on Transitions, Pulse, and Related Waveforms
年代elect a Web Site
Choose a web site to get translated content where available and see local events and offers. Based on your location, we recommend that you select:.
年代electweb siteYou can also select a web site from the following list:
Americas
- AméricaLatina(Español)
- Canada(English)
- United States(English)
欧洲
- Belgium(English)
- 丹麦(English)
- Deutschland(德意志)
- España(Español)
- Finland(English)
- 法国(Français)
- 爱尔兰(English)
- Italia(意大利语)
- Luxembourg(English)
- 荷兰(English)
- 挪威(English)
- Österreich(德意志)
- Portugal(English)
- 年代weden(English)
- 年代witzerland
- United Kingdom(English)