Combine Line and Bar Charts Using Two y-Axes
这个例子展示了如何结合使用折线图a bar chart using two differenty-axes. It also shows how to customize the line and bars.
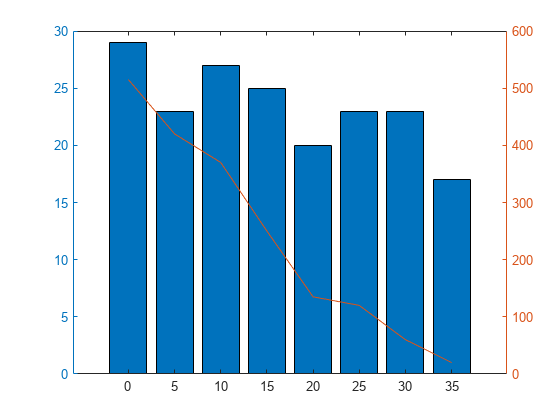
Create a chart that has twoy-axes usingyyaxis. Graphics functions target the active side of the chart. Control the active side usingyyaxis. Plot a bar chart using the lefty-axis. Plot a line chart using the righty-axis. Assign the bar series object and the chart line object to variables.
days = 0:5:35; conc = [515 420 370 250 135 120 60 20]; temp = [29 23 27 25 20 23 23 17]; yyaxisleftb = bar(days,temp); yyaxisrightp = plot(days,conc);
Add a title and axis labels to the chart.
title('Temperature and Concentration Data') xlabel('Day') yyaxisleftylabel('Temperature (\circC)') yyaxisrightylabel('Concentration')
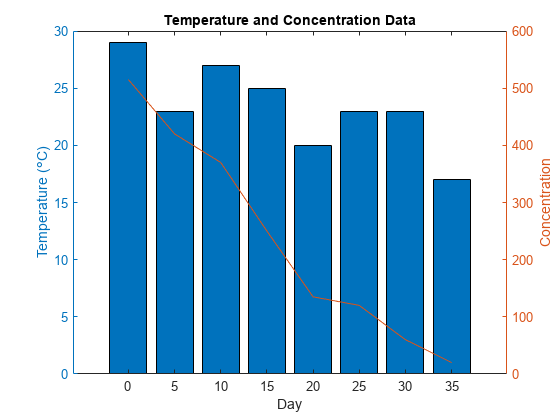
Change the width of the chart line and change the bar colors.
p.LineWidth = 3; b.FaceColor = [ 0 0.447 0.741];

See Also
Functions
Properties
You can also select a web site from the following list:
Americas
- América Latina(Español)
- Canada(English)
- United States(English)
Europe
- Belgium(English)
- Denmark(English)
- Deutschland(Deutsch)
- España(Español)
- Finland(English)
- France(Français)
- Ireland(English)
- Italia(Italiano)
- Luxembourg(English)
- Netherlands(English)
- Norway(English)
- Österreich(Deutsch)
- Portugal(English)
- Sweden(English)
- Switzerland
- United Kingdom(English)