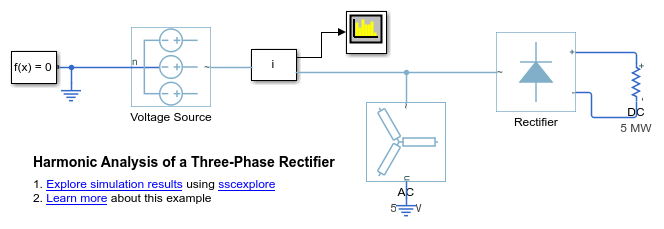
Harmonic Analysis of a Three-Phase Rectifier
This example shows how to use functions which analyze Simscape™ logging data to get harmonic magnitudes, calculate total harmonic distortion percentage and plot harmonic magnitudes. The model to which this analysis is applied is of a three-phase rectifier. The functions demonstrated are:
ee_getHarmonics
ee_calculateThdPercent
ee_plotHarmonics
Open Model
Open the model.
open_system('ee_harmonics_rectifier');
Specification of Parameters
Where:
Rated AC voltage,

Rated AC frequency,

AC real power load,

DC real power load,

Total apparent power,


For the test circuit, the AC load is set to consume 5MW, and the DC load is set to consume approximately 5MW.
V_Rated = 4160; F_Rated = 60; P_AC = 5e6; P_DC = 5e6; S_Rated = P_AC + P_DC;
Calculate Source Impedance
Where:
X/R Ratio,

Per-unit impedance,

Per-unit base impedance,

Per-unit base inductance,

Source series resistance,

Source series inductance,


XR = 15; Z_pu = 0.01; Z_base = ((V_Rated/sqrt(3))^2)/(S_Rated/3); L_base = Z_base/(2*pi*F_Rated); R_series = cos(atan(XR))*Z_pu*Z_base; L_series = sin(atan(XR))*Z_pu*L_base;
Calculate DC Resistance
Where:
Average DC voltage calculated neglecting losses,

DC resistance,


(Consult appendix for derivation of equations)
V_DC = 3*sqrt(2)*V_Rated/pi; R_DC = V_DC^2/P_DC; disp( ['DC resistance required to draw ', num2str( P_DC ),' W on DC side = ', num2str( R_DC ),' Ohm'] );
DC resistance required to draw 5000000 W on DC side = 6.3123 Ohm
Use Parameters in Simscape Model
The parameters calculated can now be used in a Simscape model,ee_harmonics_rectifier。一次simulated, the model is set to create a Simscape logging variable, simlog_ee_harmonics_rectifier.
sim卡('ee_harmonics_rectifier'); Voltage_Source_Currents = simlog_ee_harmonics_rectifier.Voltage_Source.I;

Obtain Harmonic Data
Details of harmonic order, harmonic magnitude and fundamental frequency can be obtained from a Simscape logging variable using the ee_getHarmonics function.
[ harmonicOrder, harmonicMagnitude, fundamentalFrequency ] = ee_getHarmonics( Voltage_Source_Currents );
Calculate Peak Fundamental Value
基本可以extracte的峰值d.
fundamentalPeak = harmonicMagnitude( harmonicOrder==1 ); disp( ['Peak value of fundamental = ', num2str( fundamentalPeak ),' A'] );
峰值基本= 1945.806
Remove Small Harmonics
Find and keep harmonics which are greater than one thousandth of fundamental.
threshold = fundamentalPeak ./ 1e3; aboveThresold = harmonicMagnitude > threshold; harmonicOrder = harmonicOrder( aboveThresold )'; harmonicMagnitude = harmonicMagnitude( aboveThresold )';
Display Tabular Harmonic Data
Harmonic data can be contained in a MATLAB® table.
harmonicRms = harmonicMagnitude./sqrt(2); harmonicPercentage = 100.*harmonicMagnitude./harmonicMagnitude( harmonicOrder==1 ); harmonicTable = table( harmonicOrder,。..harmonicMagnitude,。..harmonicRms,。..harmonicPercentage,。..'VariableNames', {'Order','Magnitude','RMS','Percentage'}); display( harmonicTable );
harmonicTable = 10x4 table Order Magnitude RMS Percentage _____ _________ ______ __________ 1 1945.8 1375.9 100 5 218.86 154.75 11.248 7 105.83 74.835 5.439 11 85.135 60.2 4.3753 13 57.599 40.729 2.9602 17 50.417 35.65 2.5911 19 37.612 26.596 1.933 23 33.859 23.942 1.7401 25 26.507 18.743 1.3622 29 23.979 16.955 1.2323
Total Harmonic Distortion
Calculate Total Harmonic Distortion (THD) percentage from harmonic data using the ee_calculate_ThdPercent function.
thdPercent = ee_calculateThdPercent( harmonicOrder, harmonicMagnitude ); disp( ['Total Harmonic Distortion percentage = 'num2str( thdPercent ),“%”] );
Total Harmonic Distortion percentage = 14.1721 %
Plot Harmonics
The harmonic data could be plotted from the harmonic data using the MATLAB bar function. For convenience the ee_plotHarmonics function plots a bar chart directly from the Simscape logging variable.
ee_plotHarmonics( Voltage_Source_Currents ); h1_ee_rectifier_thd = gcf;

Conclusion
This example shows how to use three functions which are callable from the MATLAB command line. The functions analyze Simscape logging data to get harmonic magnitudes, calculate total harmonic distortion percentage and plot harmonic magnitudes.
Appendix - Equations for Calculation of DC Resistance Value
The relationship between peak AC input, , and average DC output,
 , of a three-phase rectifier, neglecting losses, can be calculated as follows:


As the relationship between the rated voltage (line-line RMS), , and peak phase voltage,, is:

The relationship between rated AC voltage and average DC voltage is:

The resistance, required to draw a particular power,
 , is:
, is:

You can also select a web site from the following list:
Americas
- América Latina(Español)
- Canada(English)
- United States(English)
Europe
- Belgium(English)
- Denmark(English)
- Deutschland(Deutsch)
- España(Español)
- Finland(English)
- France(Français)
- Ireland(English)
- Italia(Italiano)
- Luxembourg(English)
- Netherlands(English)
- Norway(English)
- Österreich(Deutsch)
- Portugal(English)
- Sweden(English)
- Switzerland
- United Kingdom(English)