Export Plots in Regression Learner App
After you create plots interactively in the Regression Learner app, you can export your app plots to MATLAB®figures. You can then copy, save, or customize the new figures. Choose among the available plots:response plot,Predicted vs. Actual plot,residuals plot, and最小均方误差图.
Before exporting a plot, make sure the plot in the app displays the same data that you want in the new figure.
On theRegression Learnertab, in theExportsection, clickExport Plot to Figure. The app creates a figure from the selected plot.
The new figure might not have the same interactivity options as the plot in the Regression Learner app.
Additionally, the figure might have a different axes toolbar than the one in the app plot. For plots in Regression Learner, an axes toolbar appears above the top right of the plot. The buttons available on the toolbar depend on the contents of the plot. The toolbar can include buttons to export the plot as an image, add data tips, pan or zoom the data, and restore the view.

Copy, save, or customize the new figure, which is displayed in the figure window.
To copy the figure, selectEdit>Copy Figure. For more information, seeCopy Figure to Clipboard from Edit Menu.
To save the figure, selectFile>Save As. Alternatively, you can follow the workflow described inCustomize Figure Before Saving.
To customize the figure, click the Edit Plot button
 on the figure toolbar. Right-click the section of the plot that you want to edit. You can change the listed properties, which might includeColor,Font,Line Style, and other properties. Or, you can use theProperty Inspectorto change the figure properties.
As an example, export a response plot in the app to a figure, customize the figure, and save the modified figure.
In the MATLAB Command Window, load the
carbigdata set.loadcarbigcartable = table(Acceleration,Cylinders,Displacement,...Horsepower,Model_Year,Weight,Origin,MPG);
Click theAppstab.
In theAppssection, click the arrow to open the gallery. UnderMachine Learning and Deep Learning, clickRegression Learner.
On theRegression Learnertab, in theFilesection, click
 .
.In the New Session from Workspace dialog box, select the table
cartablefrom theWorkspace Variablelist.ClickStart Session. Regression Learner creates a response plot of the data by default.
Change the x-axis data in the response plot to
Weight.
On theRegression Learnertab, in theExportsection, clickExport Plot to Figure.
In the new figure, click the Edit Plot button
on the figure toolbar. Right-click the points in the plot. In the context menu, selectMarker>square.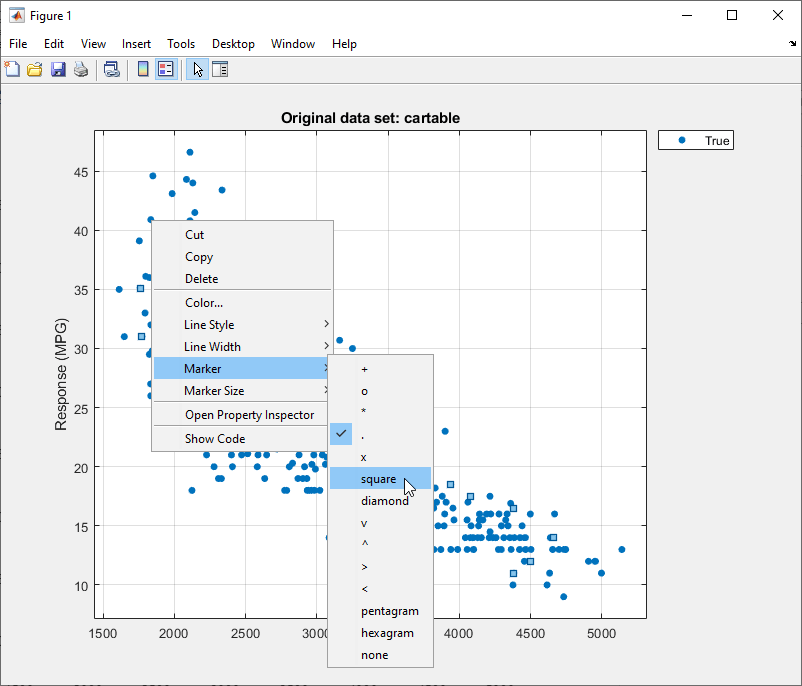
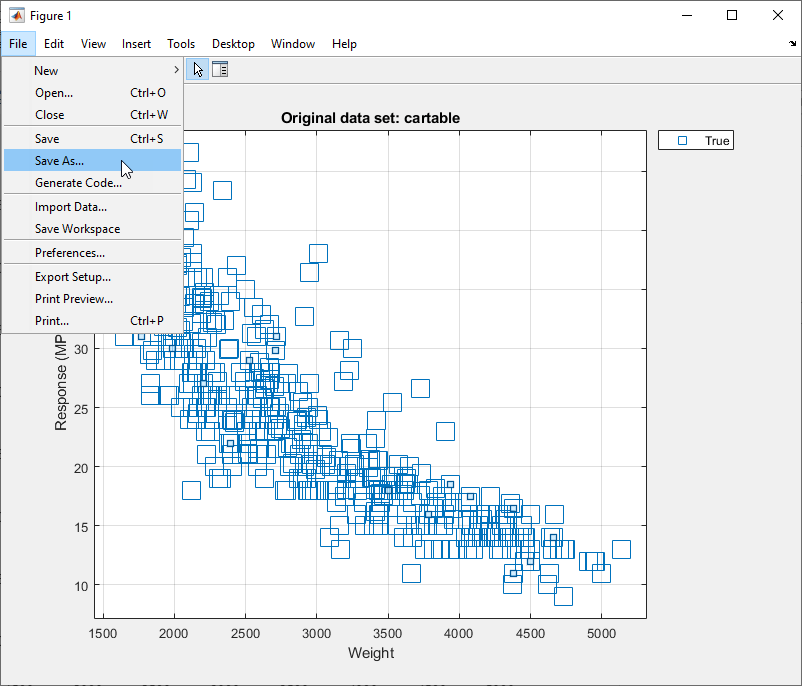
To save the figure, selectFile>Save As. Specify the saved file location, name, and type.


Related Topics
Select a Web Site
Choose a web site to get translated content where available and see local events and offers. Based on your location, we recommend that you select:.
Selectweb siteYou can also select a web site from the following list:
Americas
- 美国Latina(Español)
- Canada(English)
- United States(English)
Europe
- Belgium(English)
- Denmark(English)
- Deutschland(Deutsch)
- España(Español)
- Finland(English)
- 法国(Français)
- Ireland(English)
- Italia(Italiano)
- Luxembourg(English)
- Netherlands(English)
- Norway(English)
- Österreich(Deutsch)
- Portugal(English)
- Sweden(English)
- Switzerland
- United Kingdom(English)