Use PageRank Algorithm to Rank Websites
This example shows how to use a PageRank algorithm to rank a collection of websites. Although the PageRank algorithm was originally designed to rank search engine results, it also can be more broadly applied to the nodes in many different types of graphs. The PageRank score gives an idea of the relative importance of each graph node based on how it is connected to the other nodes.
Theoretically, the PageRank score is the limiting probability that someone randomly clicking links on each website will arrive at any particular page. So pages with a high score are highly connected and discoverable within the network, and it is more likely a random web surfer will visit that page.
Algorithm Description
At each step in the PageRank algorithm, the score of each page is updated according to,
r = (1-P)/n + P*(A'*(r./d) + s/n);
ris a vector of PageRank scores.Pis a scalar damping factor (usually 0.85), which is the probability that a random surfer clicks on a link on the current page, instead of continuing on another random page.A'is the transpose of the adjacency matrix of the graph.dis a vector containing the out-degree of each node in the graph.dis set to1for nodes with no outgoing edges.nis the scalar number of nodes in the graph.sis the scalar sum of the PageRank scores for pages with no links.
In other words, the rank of each page is largely based on the ranks of the pages that link to it. The termA'*(r./d)picks out the scores of the source nodes that link to each node in the graph, and the scores are normalized by the total number of outbound links of those source nodes. This ensures that the sum of the PageRank scores is always1. For example, if node 2 links to nodes 1, 3, and 4, then it transfers1/3of its PageRank score to each of those nodes during each iteration of the algorithm.
Create a graph that illustrates how each node confers its PageRank score to the other nodes in the graph.
s = {'a''a''a''b''b''c''d''d''d'}; t = {'b''c''d''d''a''b''c''a''b'}; G = digraph(s,t); labels = {'a/3''a/3''a/3''b/2''b/2''c''d/3''d/3''d/3'}; p = plot(G,'Layout','layered','EdgeLabel',labels); highlight(p,[1 1 1],[2 3 4],'EdgeColor','g') highlight(p,[2 2],[1 4],'EdgeColor','r') highlight(p,3,2,'EdgeColor','m') title('PageRank Score Transfer Between Nodes')

Thecentralityfunction contains an option for calculating PageRank scores.
PageRank with 6 Nodes
Create and plot a directed graph containing six nodes representing fictitious websites.
s = [1 1 2 2 3 3 3 4 5]; t = [2 5 3 4 4 5 6 1 1]; names = {'http://www.example.com/alpha','http://www.example.com/beta',...'http://www.example.com/gamma','http://www.example.com/delta',...'http://www.example.com/epsilon','http://www.example.com/zeta'}; G = digraph(s,t,[],names)
G = digraph with properties: Edges: [9x1 table] Nodes: [6x1 table]
plot(G,'Layout','layered',...'NodeLabel',{'alpha','beta','gamma','delta','epsilon','zeta'})

Calculate the PageRank centrality score for this graph. Use a follow probability (otherwise known as a damping factor) of0.85.
pr = centrality(G,'pagerank','FollowProbability',0.85)
pr =6×10.3210 0.1706 0.1066 0.1368 0.2008 0.0643
View the PageRank scores and degree information for each page.
G.Nodes.PageRank =公关;G.Nodes.InDegree =indegree(G); G.Nodes.OutDegree = outdegree(G); G.Nodes
ans=6×4 tableName PageRank InDegree OutDegree __________________________________ ________ ________ _________ {'http://www.example.com/alpha' } 0.32098 2 2 {'http://www.example.com/beta' } 0.17057 1 2 {'http://www.example.com/gamma' } 0.10657 1 3 {'http://www.example.com/delta' } 0.13678 2 1 {'http://www.example.com/epsilon'} 0.20078 2 1 {'http://www.example.com/zeta' } 0.06432 1 0
The results show that it is not just thenumberof page links that determines the score, but also thequality. Thealphaandgammawebsites both have a total degree of 4, howeveralphalinks to bothepsilonandbeta, which also are highly ranked.gammais only linked to by one page,beta, which is in the middle of the list. Thus,alphais scored higher thangammaby the algorithm.
PageRank of Websites on mathworks.com
Load the data inmathworks100.matand view the adjacency matrix,A. This data was generated in 2015 using an automatic page crawler. The page crawler began at//www.tatmou.comand followed links to subsequent web pages until the adjacency matrix contained information on the connections of 100 unique web pages.
loadmathworks100.matspy(A)

Create a directed graph with the sparse adjacency matrix,A, using the URLs contained inUas node names.
G = digraph(A,U)
G = digraph with properties: Edges: [632x1 table] Nodes: [100x1 table]
Plot the graph using the force layout.
plot(G,'NodeLabel',{},'NodeColor',[0.93 0.78 0],'Layout','force'); title('Websites linked to //www.tatmou.com')

Compute the PageRank scores for the graph,G, using 200 iterations and a damping factor of0.85. Add the scores and degree information to the nodes table of the graph.
pr = centrality(G,'pagerank','MaxIterations',200,'FollowProbability', 0.85);G.Nodes.PageRank =公关;G.Nodes.InDegree =indegree(G); G.Nodes.OutDegree = outdegree(G);
View the top 25 resulting scores.
G.Nodes(1:25,:)
ans=25×4 tableName PageRank InDegree OutDegree ______________________________________________________________________________ ________ ________ _________ {'//www.tatmou.com/it/' } 0.044342 20 14 {'//www.tatmou.com/ch' } 0.043085 20 14 {'https://cn.mathworks.com' } 0.043085 20 14 {'//www.tatmou.com/jp' } 0.043085 20 14 {'//www.tatmou.com/kr' } 0.043085 20 14 {'//www.tatmou.com/uk' } 0.043085 20 14 {'//www.tatmou.com/au' } 0.043085 20 14 {'//www.tatmou.com/de' } 0.043085 20 14 {'//www.tatmou.com/es' } 0.043085 20 14 {'//www.tatmou.com/fr' } 0.043085 20 14 {'//www.tatmou.com/in' } 0.043085 20 14 {'//www.tatmou.com/it/' } 0.043085 20 14 {'//www.tatmou.com/nl' } 0.043085 20 14 {'//www.tatmou.com/se' } 0.043085 20 14 {'//www.tatmou.com/index.html%3Fnocookie%3Dtrue' } 0.0015 0 1 {'//www.tatmou.com/company/aboutus/policies_statements/patents.html'} 0.007714 6 6 ⋮
Extract and plot a subgraph containing all nodes whose score is greater than0.005. Color the graph nodes based on their PageRank score.
H = subgraph(G,find(G.Nodes.PageRank > 0.005)); plot(H,'NodeLabel',{},'NodeCData',H.Nodes.PageRank,'Layout','force'); title('Websites linked to //www.tatmou.com') colorbar
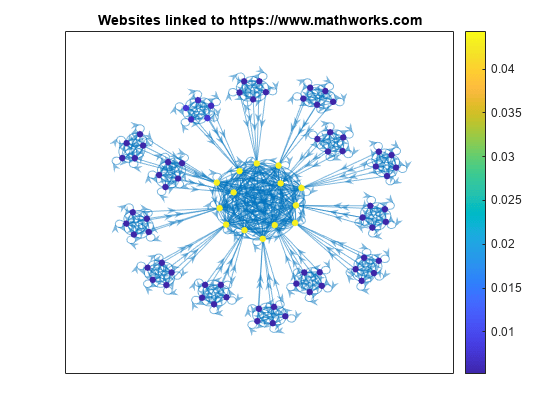
The PageRank scores for the top websites are all quite similar, such that a random web surfer has about a 4.5% chance to land on each page. This small group of highly connected pages forms a clique in the center of the plot. Connected to this central clique are several smaller cliques, which are highly connected amongst themselves.
References
Moler, C.Experiments with MATLAB.Chapter 7: Google PageRank. MathWorks, Inc., 2011.
See Also
You can also select a web site from the following list:
Americas
- América Latina(Español)
- Canada(English)
- United States(English)
Europe
- Belgium(English)
- Denmark(English)
- Deutschland(Deutsch)
- España(Español)
- Finland(English)
- France(Français)
- Ireland(English)
- Italia(Italiano)
- Luxembourg(English)
- Netherlands(English)
- Norway(English)
- Österreich(Deutsch)
- Portugal(English)
- Sweden(English)
- Switzerland
- United Kingdom(English)