MATLAB Plot Gallery - Graph Plot 2
버전 1.0.0.1(66.2 KB) 작성자:
MathWorks Plot Gallery Team
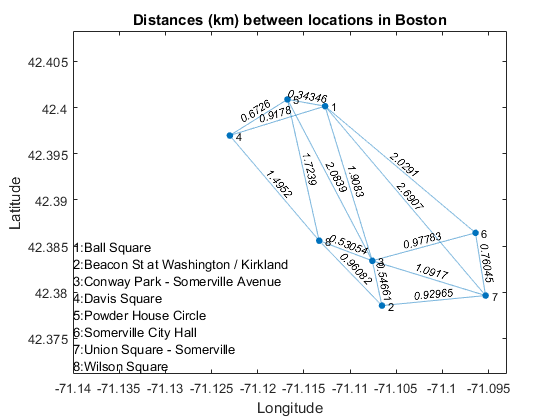
Create a graph plot
This is an example of how to create a graph plot in MATLAB®.
Read about the "graph" function in the MATLAB documentation. This function is available in R2015b or newer.
For more examples, go to MATLAB Plot Gallery -//www.tatmou.com/discovery/gallery.html
인용 양식
MathWorks Plot Gallery Team (2023).MATLAB Plot Gallery - Graph Plot 2(//www.tatmou.com/matlabcentral/fileexchange/63455-matlab-plot-gallery-graph-plot-2), MATLAB Central File Exchange. 검색됨.
MATLAB 릴리스 호환 정보
개발 환경: R2015b
모든 릴리스와 호환
플랫폼 호환성
Windows macOS Linux카테고리
Help Center및MATLAB Answers에서Discrete Data Plots에 대해 자세히 알아보기
태그
Community Treasure Hunt
Find the treasures in MATLAB Central and discover how the community can help you!
Start Hunting!You can also select a web site from the following list:
Americas
- América Latina(Español)
- Canada(English)
- United States(English)
Europe
- Belgium(English)
- Denmark(English)
- Deutschland(Deutsch)
- España(Español)
- Finland(English)
- France(Français)
- Ireland(English)
- Italia(Italiano)
- Luxembourg(English)
- Netherlands(English)
- Norway(English)
- Österreich(Deutsch)
- Portugal(English)
- Sweden(English)
- Switzerland
- United Kingdom(English)
Asia Pacific
- Australia(English)
- India(English)
- New Zealand(English)
- 中国
- 日本Japanese(日本語)
- 한국Korean(한국어)