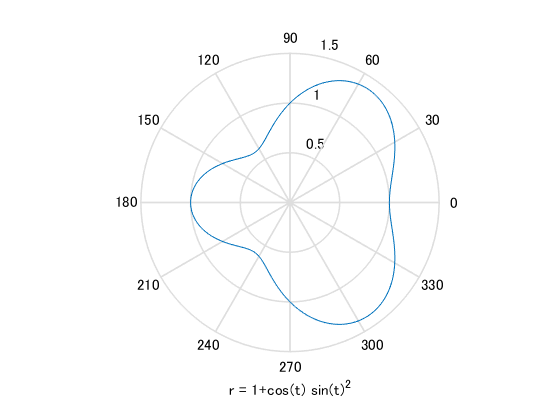
这是如何从MATLAB中的函数创建极性图的示例®。
读取Matlab文档中的“Ezpolar”功能。
有关更多示例,请转到Matlab Plot Gallery -//www.tatmou.com/discovery/gallery.html.
引用
Mathworks Plot Gallery团队(2021)。Matlab Plot Gallery - 功能极性图(//www.tatmou.com/matlabcentral/fileexchange/35285-matlab-plot-gallery-function-polar-plot),matlab中央文件exchange。检索到。
评论和评级(0.)
您还可以从以下列表中选择一个网站: