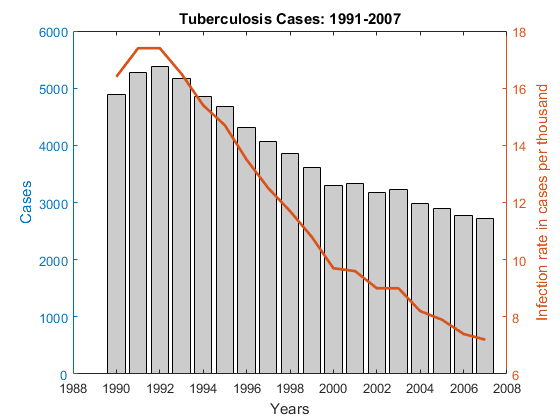
这是如何在Matlab中创建具有两个Y轴的绘图的示例®。
阅读Matlab文档中的“Yyaxis”功能。此功能可在R2016A或更新中提供。
有关更多示例,请转到Matlab Plot Gallery -//www.tatmou.com/discovery/gallery.html.
引用
Mathworks Plot Gallery团队(2021)。Matlab Plot Gallery - 两个y轴图(2)(//www.tatmou.com/matlabcentral/fileexchange/35296-matlab-plot-gallery-two-y-axis-plot-2),Matlab中央文件交换。检索到。
评论和评级(0.)
您还可以从以下列表中选择一个网站: