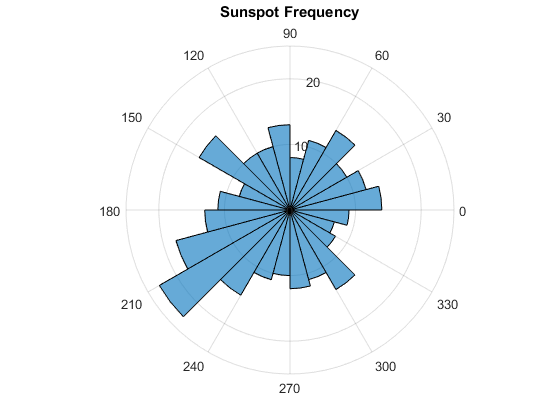
这是如何在MATLAB中创建极性直方图的示例®。
读取Matlab文档中的“偏振图”功能。此功能可在R2016B或更新中提供。
有关更多示例,请转到Matlab Plot Gallery -//www.tatmou.com/discovery/gallery.html.
引用
Mathworks Plot Gallery团队(2021)。Matlab Plot Gallery - Polar直方图(//www.tatmou.com/matlabcentral/fileexchange/63453-matlab-plot-gallery-polar-histogram),matlab中央文件exchange。检索到。
评论和评级(1)
Kamna Kumar.
您还可以从以下列表中选择一个网站: