linecm
linecm
Plot a line with changing color over the course of a line.
To plot a line, run
linecm(x,y, @colormap_functionhandle);
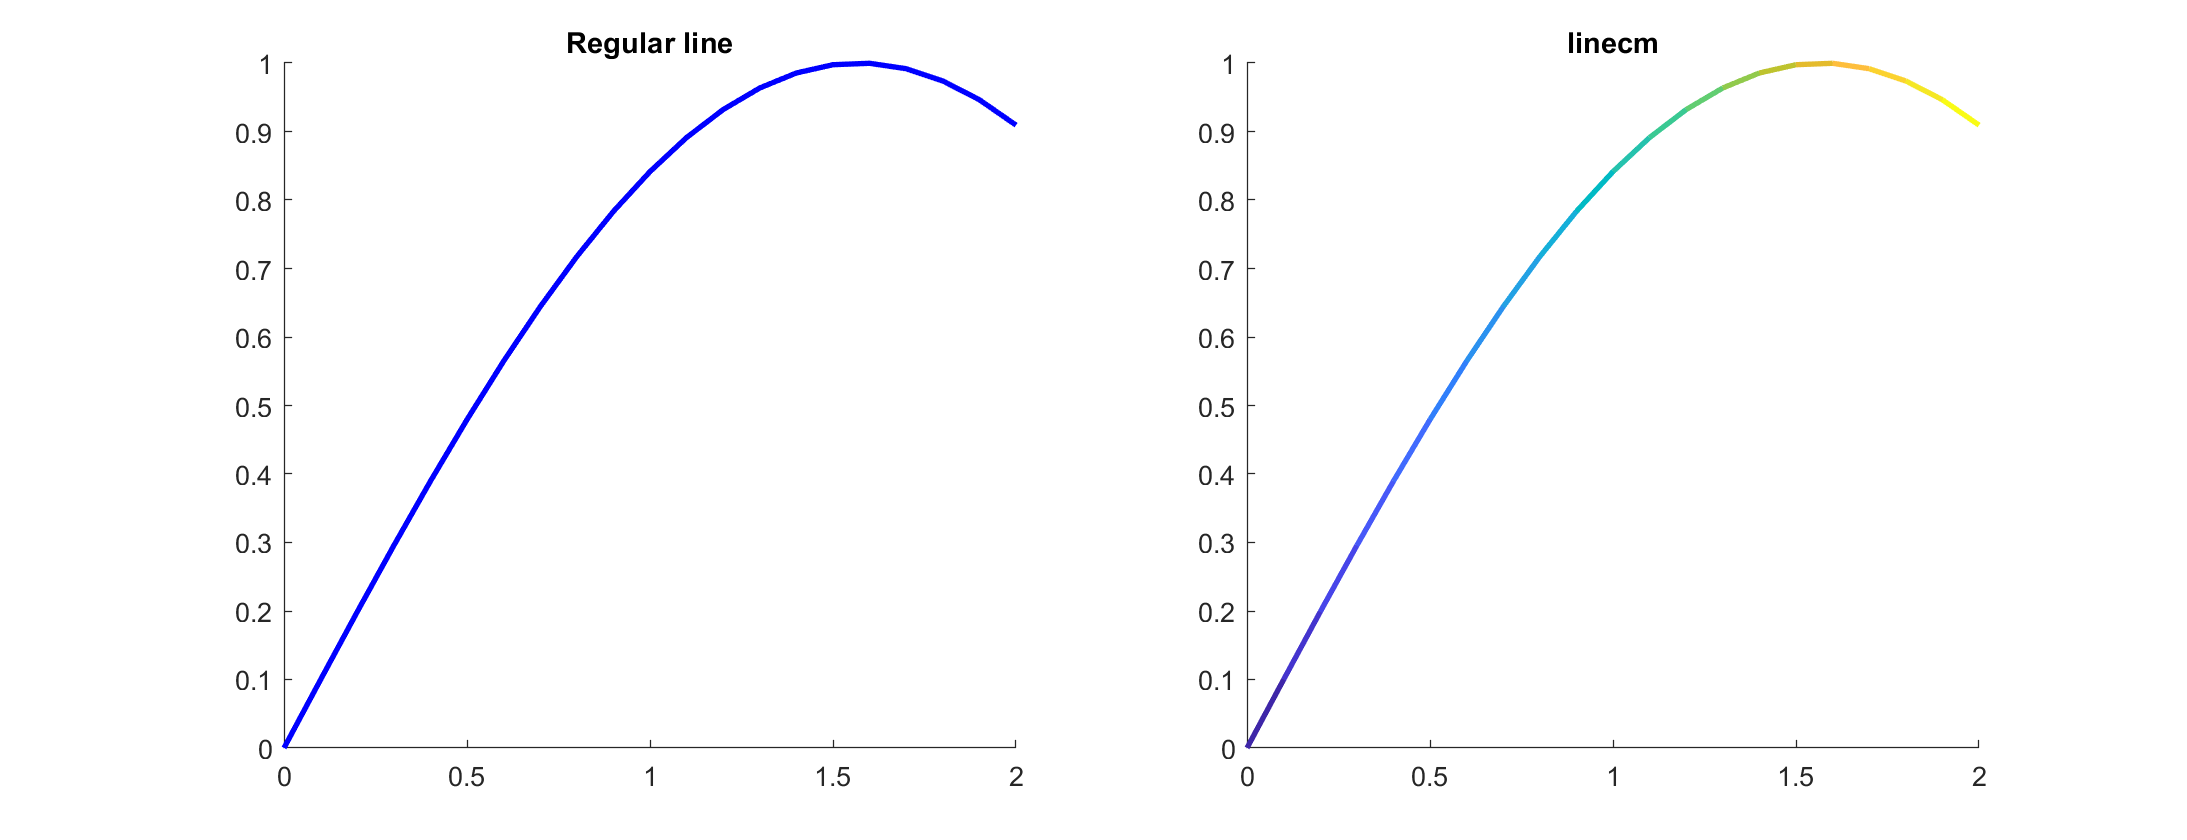
Just like that! You now have a much better looking line. Here is an example:
set(0,'DefaultLineLineWidth',2); x=0:0.1:2; y=sin(x);subplot(1,2,1)line(x,y,'Color','b')title("Regular line")subplot(1,2,2)linecm(x,y, @parula);%semicolon is recommendedtitle("linecm")
很明显,linecmlooks much better!
Colormaps
In this file, two additional colormaps have been added:coolwarmandbwr, inspired by matplotlib. You can read more about themhere.
Similar programs
There is a similar program available calledcolormaplinewhich might be less error prone.
Trivia
Might be quite obvious butlinecmstands for "line colormap".
Cite As
Simon Thor (2022).linecm(https://github.com/simonthor/linecm/releases/tag/v1.2.0), GitHub. Retrieved.
MATLAB Release Compatibility
Platform Compatibility
Windows macOS LinuxTags
Community Treasure Hunt
Find the treasures in MATLAB Central and discover how the community can help you!
Start Hunting!Discover Live Editor
Create scripts with code, output, and formatted text in a single executable document.


