Curve Fitting Toolbox
Fit curves and surfaces to data using regression, interpolation, and smoothing

Curve Fitting Toolbox™provides an appand functions for fitting curves and surfaces to data. The toolbox lets you perform exploratory data analysis, preprocess and post-process data, compare candidate models, and remove outliers. You can conduct regression analysis using the library of linear and nonlinear models provided or specify your own custom equations. The library provides optimized solver parameters and starting conditions to improve the quality of your fits. The toolbox also supports nonparametric modeling techniques, such as splines, interpolation, and smoothing.
After creating a fit, you can apply a variety of post-processing methods for plotting, interpolation, and extrapolation; estimating confidence intervals; and calculating integrals and derivatives.
Get Started:
Curve Fitting App
Fit curves using the Curve Fitting app or command-line fit functions.

Curve Fitting using the Curve Fitting App.
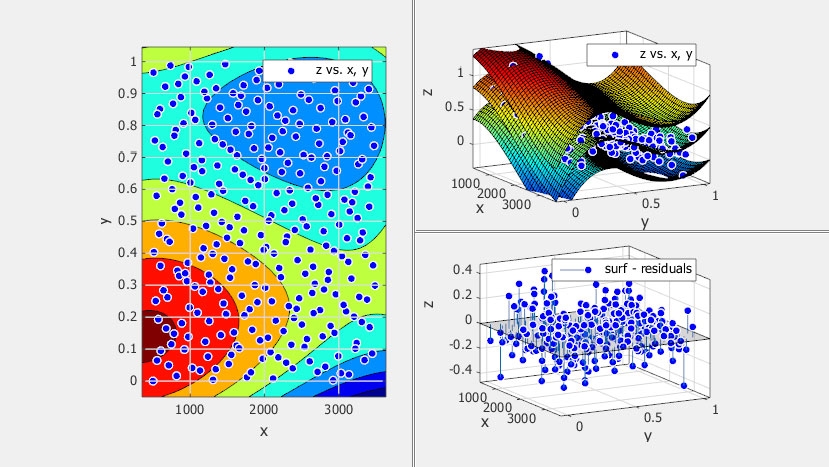
Surface Fitting
Fit surfaces using the Curve Fitting app or command-line fit functions.

表面使用曲线拟合程序拟合。
Linear Fitting
Apply linear regression by choosing from standard regression models or by using custom equations. All of the standard regression models include optimized solver parameters and starting conditions to improve fit quality.

Overview of Linear Regression Techniques.
Nonlinear Fitting
Apply nonlinear parametric regression using exponentials, Fourier series, power series, Gaussians, and standard models.

Surface Fitting With Custom Equations to Biopharmaceutical Data
Interpolation
Fit interpolating curves or surfaces, and estimate values between known data points.

Comparing Linear Interpolant Models.
Smoothing
Smooth data with moving average, smoothing splines, and localized regression.

Differences Between Model and Table Data in Investigating Fuel Efficiency.
Compare and Evaluate Fits
Create multiple fits, compare graphical and numerical results, and goodness-of-fit statistics. Use validation data to refine your fit.

Creating Multiple Fits in Curve Fitting App.
Plotting
Customize plotting and perform additional analyses such as outliers, residuals, confidence intervals, integrals, and derivatives.
Displaying and Customizing Plots.
Fitting Splines to Data
Fit various splines to data, including cubic and smoothing splines with various end conditions, for curves, surfaces, and higher dimensional objects.

样条拟合钛测试数据.
B-Splines, Rational Splines, and NURBS
Create B-Splines and Uniform and Non-uniform Rational Splines (NURBS) for analysis of complex surfaces.

3D Spline.
