Maximum Likelihood Estimation
Themlefunction computes maximum likelihood estimates (MLEs) for a distribution specified by its name and for a custom distribution specified by its probability density function (pdf), log pdf, or negative log likelihood function.
For some distributions, MLEs can be given in closed form and computed directly. For other distributions, a search for the maximum likelihood must be employed. The search can be controlled with anoptionsinput argument, created using thestatsetfunction. For efficient searches, it is important to choose a reasonable distribution model and set appropriate convergence tolerances.
MLEs can be biased, especially for small samples. As sample size increases, however, MLEs become unbiased minimum variance estimators with approximate normal distributions. This is used to compute confidence bounds for the estimates.
For example, consider the following distribution of means from repeated random samples of an exponential distribution:
mu = 1;% Population parametern = 1e3;% Sample sizens = 1e4;% Number of samplesrng('default')% For reproducibilitysamples = exprnd(mu,n,ns);% Population samplesmeans = mean(samples);% Sample means
The Central Limit Theorem says that the means will be approximately normally distributed, regardless of the distribution of the data in the samples. Themlefunction can be used to find the normal distribution that best fits the means:
[phat,pci] = mle(means)
phat =1×21.0000 0.0315
pci =2×20.9994 0.0311 1.0006 0.0319
phat(1)andphat(2)are the MLEs for the mean and standard deviation.pci(:,1)andpci(:,1)are the corresponding 95% confidence intervals.
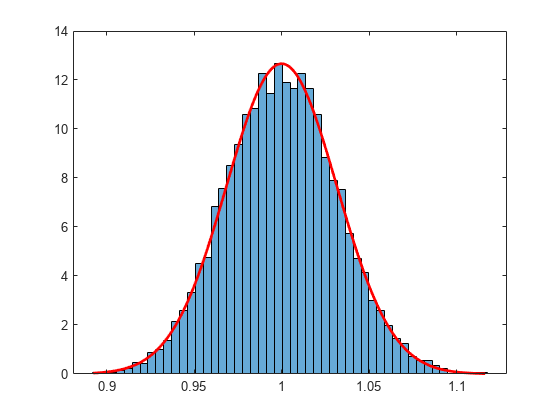
Visualize the distribution of sample means together with the fitted normal distribution.
numbins = 50; histogram(means,numbins,'Normalization','pdf') holdonx = min(means):0.001:max(means); y = normpdf(x,phat(1),phat(2)); plot(x,y,'r','LineWidth',2)
See Also
Related Examples
More About
You can also select a web site from the following list:
Americas
- América Latina(Español)
- Canada(English)
- United States(English)
Europe
- Belgium(English)
- Denmark(English)
- Deutschland(Deutsch)
- España(Español)
- Finland(English)
- France(Français)
- Ireland(English)
- Italia(Italiano)
- Luxembourg(English)
- Netherlands(English)
- Norway(English)
- Österreich(Deutsch)
- Portugal(English)
- Sweden(English)
- Switzerland
- United Kingdom(English)