
你的作品在一个月内被下载了250次或更多
2019年11月1日授予萨蒂亚那拉扬·拉奥

发布你的第一篇评论
2019年10月09日授予Sathyanarayan Rao

你的作品获得了25个五星评级
2019年10月09日授予Sathyanarayan Rao

发布你的第一次提交
2019年10月09日授予Sathyanarayan Rao

回答一个30多天没有回答的问题
2017年7月20日授予Sathyanarayan Rao

为别人的问题提供你的第一个答案
2017年7月20日授予Sathyanarayan Rao

第一次解决一个问题
2015年1月26日授予Sathyanarayan Rao
内容提要


回答
可视化最小,最大和平均
X = [1 2 3 4 5];Ymin = [0.01 0.02 0.03 0.04 0.05];%下误差条位置ymax = [0.02 0.03 0.04 0.05 0.06];%重复…
可视化最小,最大和平均
X = [1 2 3 4 5];Ymin = [0.01 0.02 0.03 0.04 0.05];%下误差条位置ymax = [0.02 0.03 0.04 0.05 0.06];%重复…
4年前| 0
回答
如何用最大值和最小值绘制条形图
X = [1 2 3 4 5];Ymin = [0.01 0.02 0.03 0.04 0.05];%下误差条位置ymax = [0.02 0.03 0.04 0.05 0.06];%重复…
如何用最大值和最小值绘制条形图
X = [1 2 3 4 5];Ymin = [0.01 0.02 0.03 0.04 0.05];%下误差条位置ymax = [0.02 0.03 0.04 0.05 0.06];%重复…
4年前| 0
回答
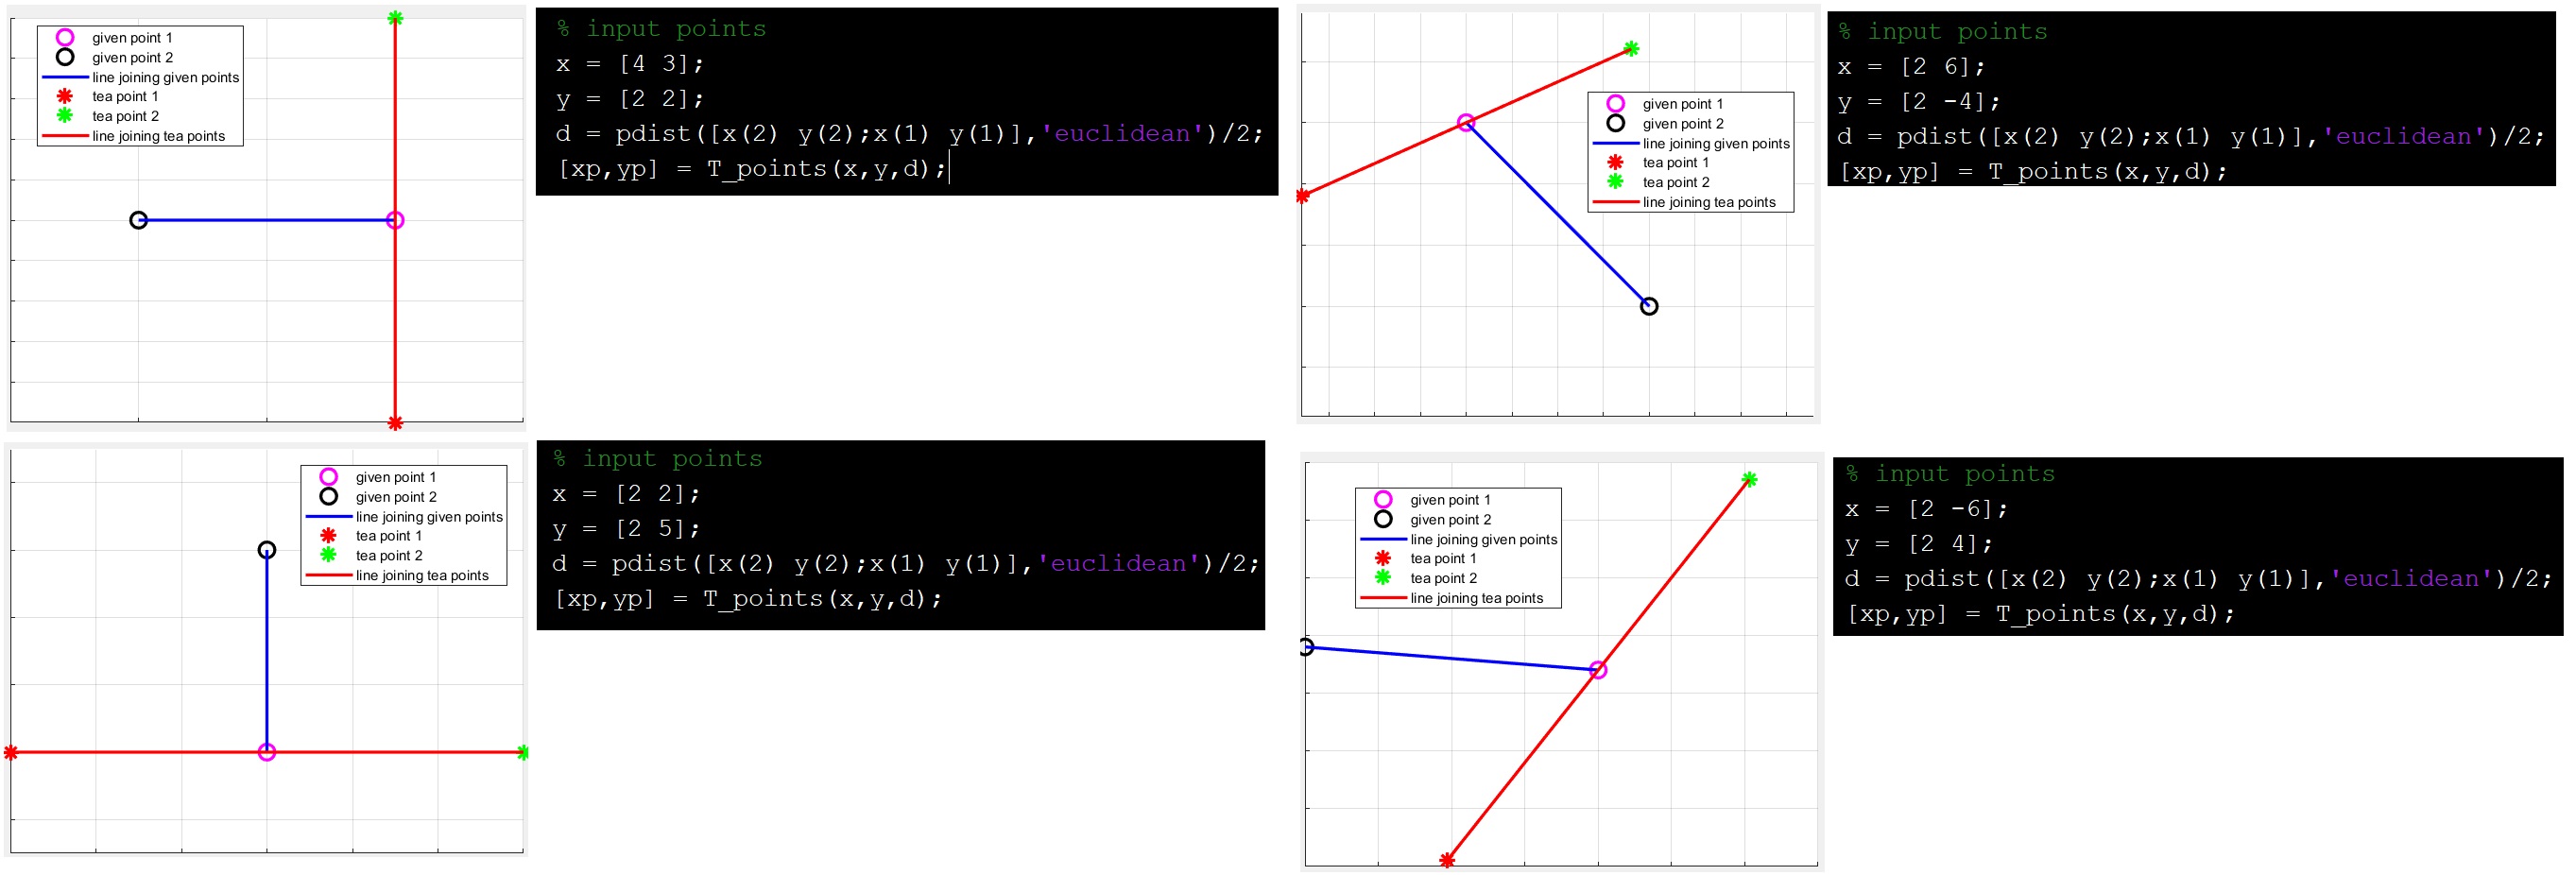
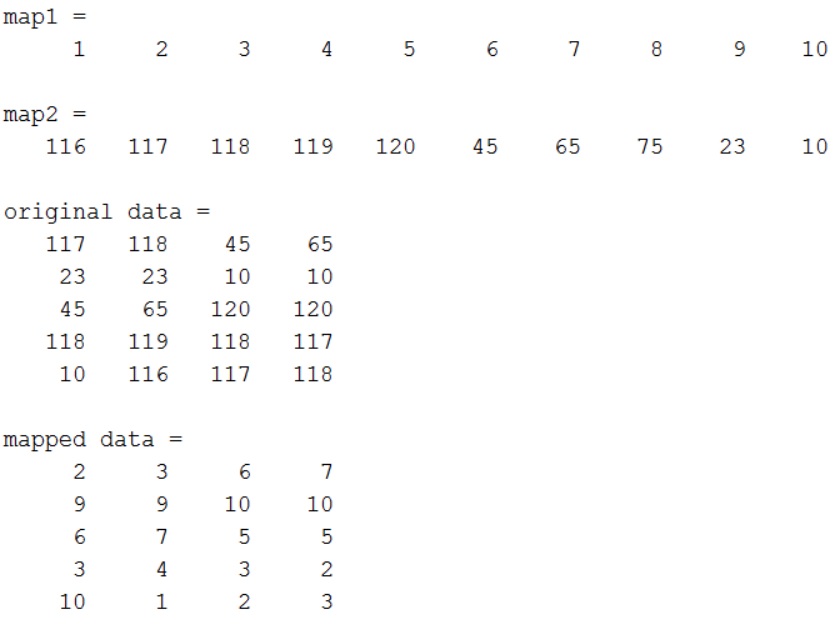
如何提取数据从一个plot的不同值的X和Y轴?
速度=[1 2 3 4 5]时间= [0.03 0.05 0.07 0.09 0.1]h = plot(时间,速度);xdata = (get(h, ' xdata ')) ydata =…
如何提取数据从一个plot的不同值的X和Y轴?
速度=[1 2 3 4 5]时间= [0.03 0.05 0.07 0.09 0.1]h = plot(时间,速度);xdata = (get(h, ' xdata ')) ydata =…
4年前| 0
回答
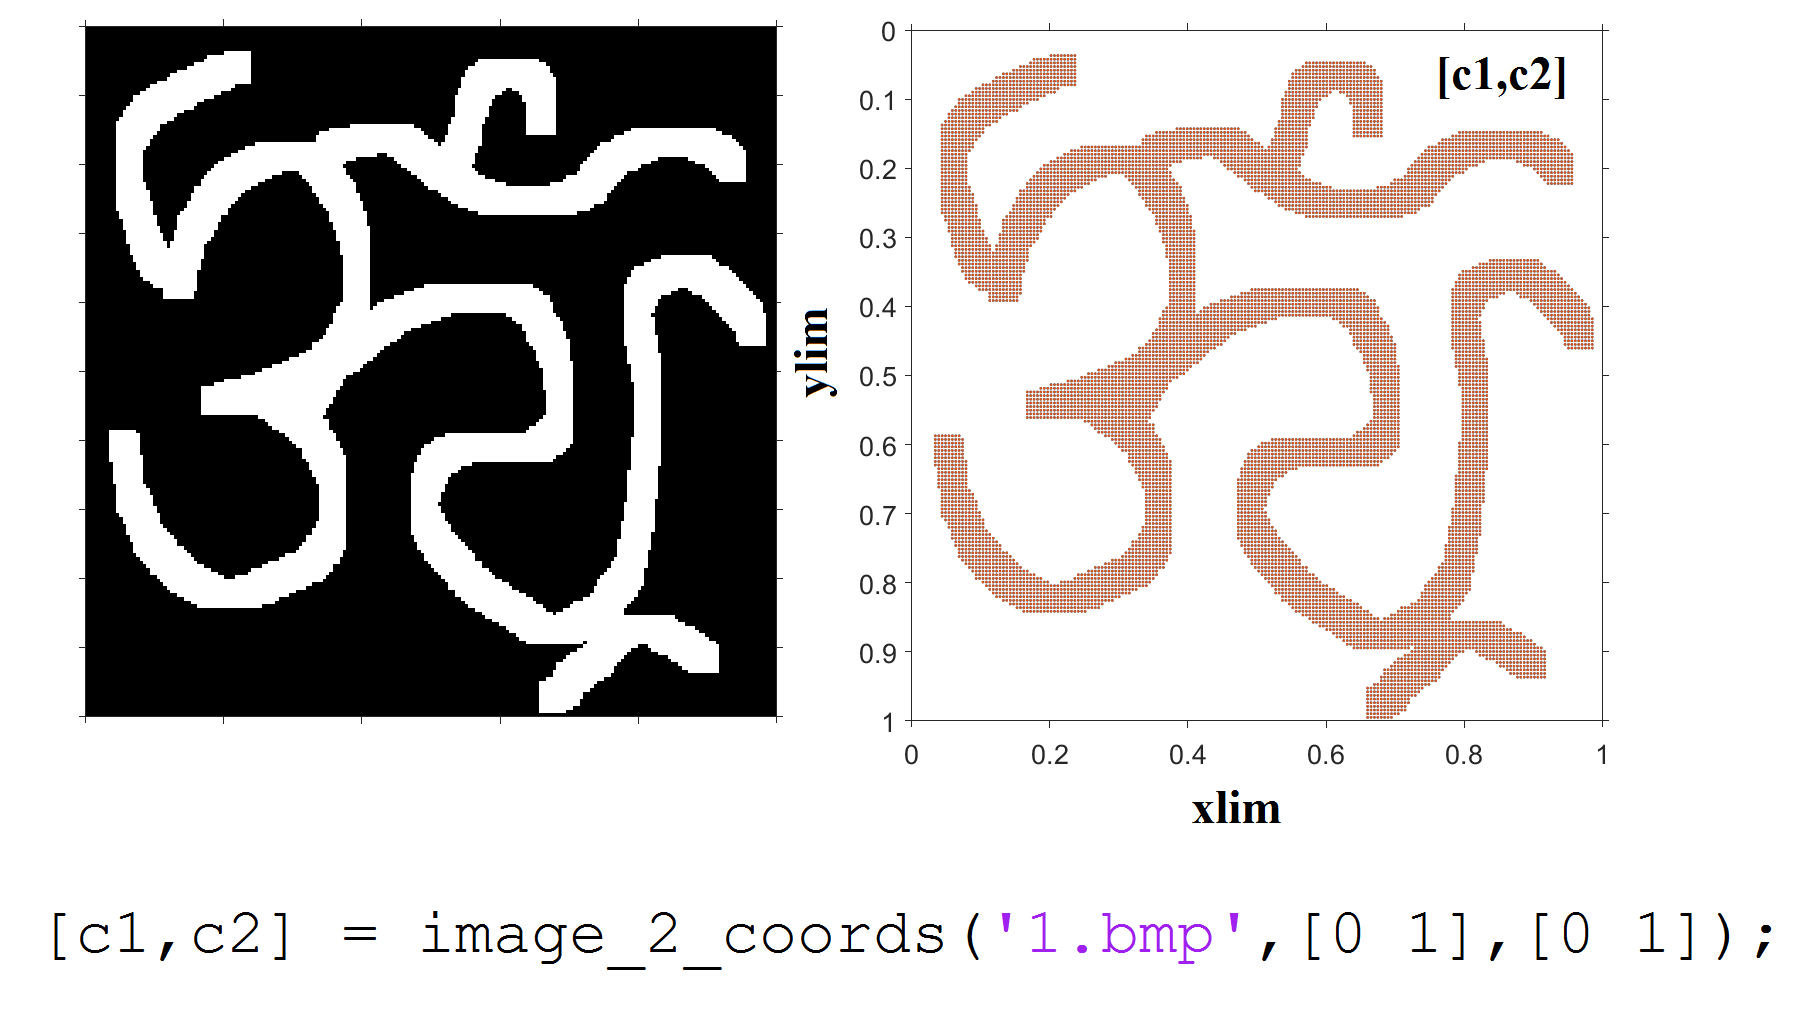
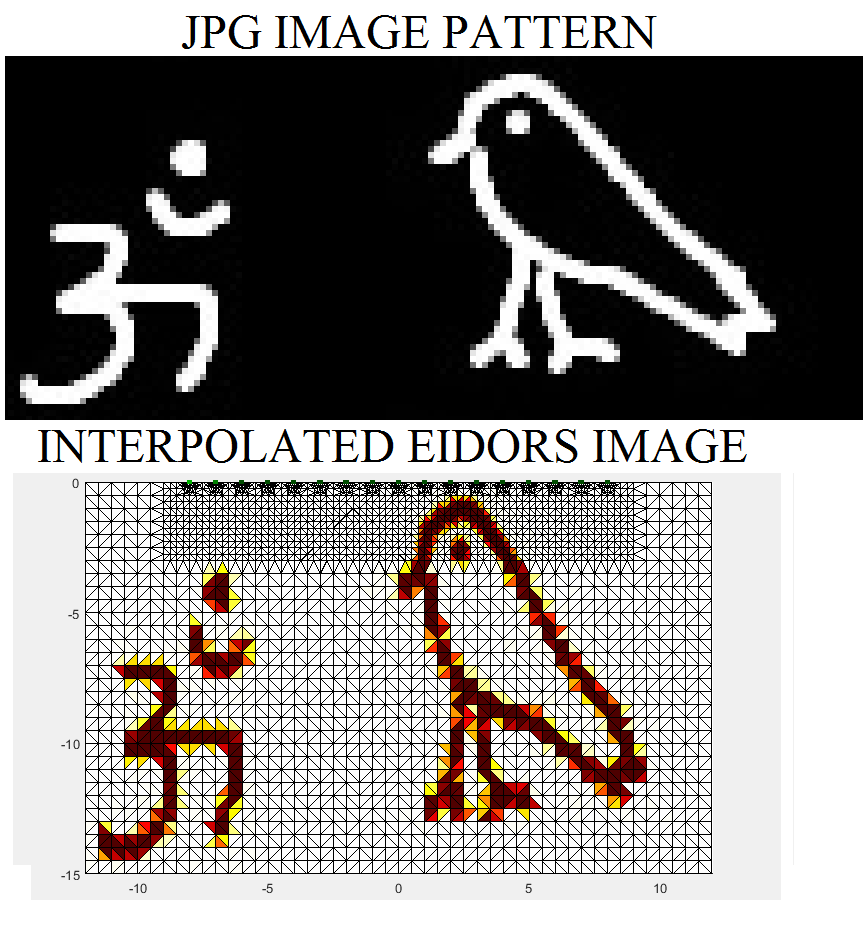
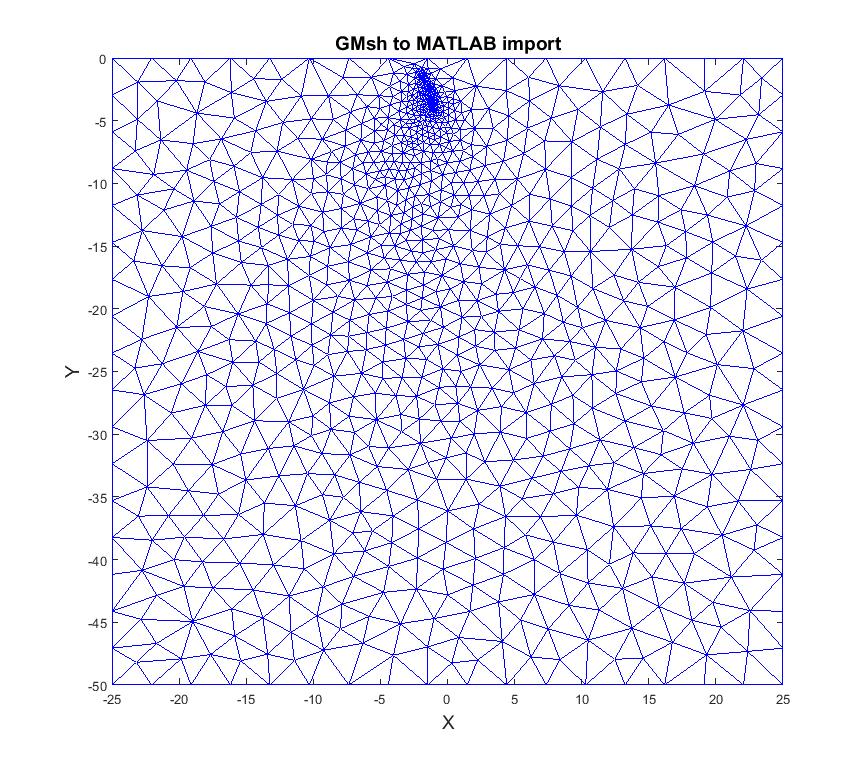
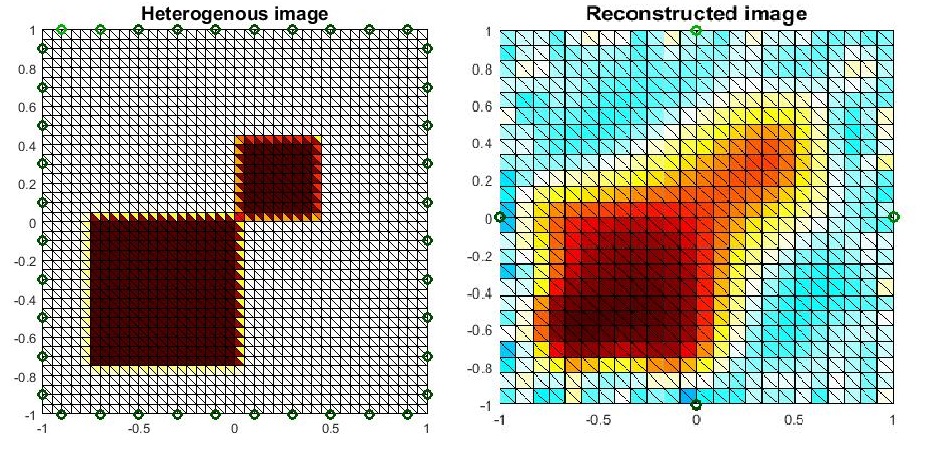
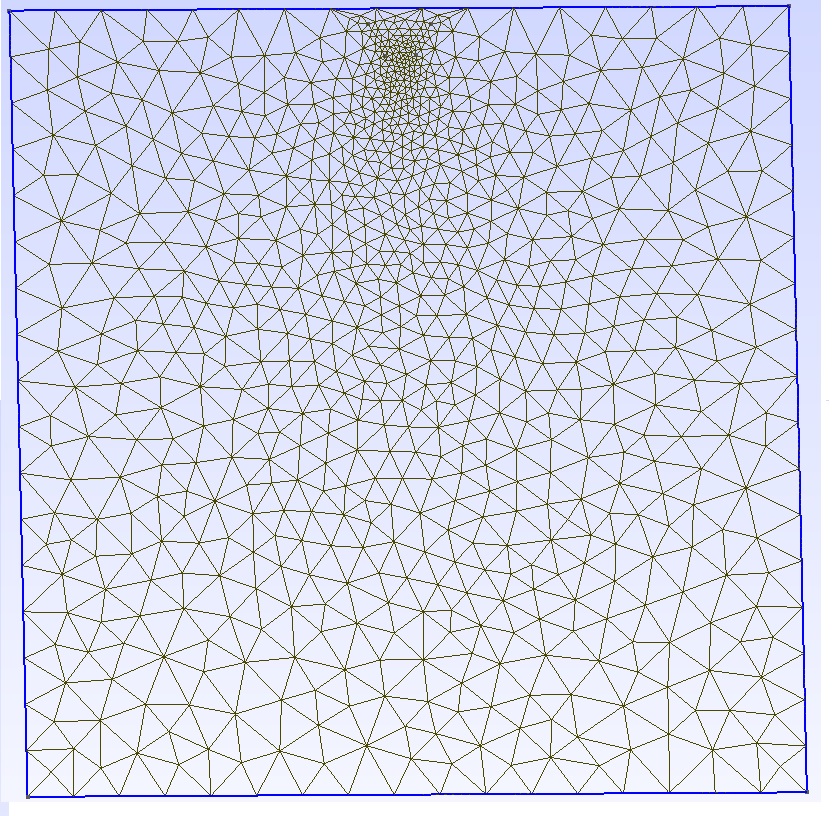
如何将二值图像转换为二维三角测量?
检查这个代码使用Gmsh https://nl.mathworks.com/matlabcentral/fileexchange/61507-binary-image-to-finite-element-mesh…
如何将二值图像转换为二维三角测量?
检查这个代码使用Gmsh https://nl.mathworks.com/matlabcentral/fileexchange/61507-binary-image-to-finite-element-mesh…
4年前| 0

回答
读取。msh文件中的节点和元素到Matlab中
请查看http://nl.mathworks.com/matlabcentral/fileexchange/59682-visualizing-gmsh-msh-file-in-matlab-using-triplot并让…
读取。msh文件中的节点和元素到Matlab中
请查看http://nl.mathworks.com/matlabcentral/fileexchange/59682-visualizing-gmsh-msh-file-in-matlab-using-triplot并让…
5年前| 0
