scatterplot
Generate scatter plot
Syntax
Description
scatterplot(specifies plot attributes for the scatter plot.x,n,offset,plotstring)
scatterplot(generates the scatter plot in the existingx,n,offset,plotstring,scatfig)Figureobject,scatfig. To plot multiple signals in the same figure, usehold on.
scatfig= scatterplot(___)Figureobject of the scatter plot. Usescatfigto query or modify properties of the figure after it is created. You can specify any of the input argument combinations from the previous syntaxes.
Examples
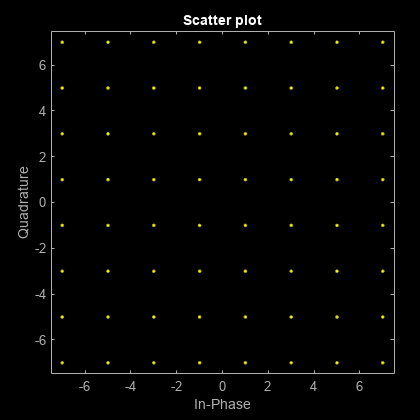
Generate Scatter Plot of 64-QAM Signal
Create a 64-QAM signal in which each constellation point is used.
d = (0:63)'; s = qammod(d,64);
Display the scatter plot of the constellation.
scatterplot(s)
Input Arguments
Output Arguments
See Also
Functions
Objects
Select a Web Site
Choose a web site to get translated content where available and see local events and offers. Based on your location, we recommend that you select:.
Selectweb siteYou can also select a web site from the following list:
Americas
- América Latina(Español)
- Canada(English)
- United States(English)
Europe
- Belgium(English)
- Denmark(English)
- Deutschland(Deutsch)
- España(Español)
- Finland(English)
- France(Français)
- Ireland(English)
- Italia(Italiano)
- Luxembourg(English)
- Netherlands(English)
- Norway(English)
- Österreich(Deutsch)
- Portugal(English)
- Sweden(English)
- Switzerland
- United Kingdom(English)