表面适合生物制药数据
曲线拟合工具箱™ software provides some example data for an anesthesia drug interaction study. You can use Curve Fitting app to fit response surfaces to this data to analyze drug interaction effects. Response surface models provide a good method for understanding the pharmacodynamic interaction behavior of drug combinations.
此数据基于本文的结果:
Kern SE, Xie G, White JL, Egan TD. Opioid-hypnotic synergy: A response surface analysis of propofol-remifentanil pharmacodynamic interaction in volunteers. Anesthesiology 2004; 100: 1373–81.
麻醉通常至少两种药物过程s, consisting of an opioid and a sedative hypnotic. This example uses Propofol and Reminfentanil as drug class prototypes. Their interaction is measured by four different measures of the analgesic and sedative response to the drug combination. Algometry, Tetany, Sedation, and Laryingoscopy comprise the four measures of surrogate drug effects at various concentration combinations of Propofol and Reminfentanil.
为了交互地为该药物组合产生响应表面:
Use the Current Folder browser to locate and view the folder
matlab \ toolbox \ curvefit \ curvefit。右键单击该文件
OpioidHypnoticSynergy.txt,选择导入数据。The Import Wizard appears.留下默认值Column delimiters设置Taband列向量in the Import tab.
点评审查six variables selected for import: Propofol, Reminfentanil, Algometry, Tetany, Sedation, and Laryingoscopy.
On the Import tab, in the Import section, click进口选择至import the dose-response data into the MATLAB®工作区。
或者,您可以以编程方式导入数据。输入以下代码以将文件中的剂量响应数据读入MATLAB工作区。
data = importdata('opioidhypnoticsynergergy.txt');propofol = data.data(:,1);remifentanil = data.data(:,2);Algometry = data.data(:,3);tetany = data.data(:,4);镇静= data.data(:,5);learyingoscopy = data.data(:,6);
要创建响应曲面,您必须为x和y输入选择两个药物,以及z输出的四个效果之一。将变量加载到工作区后,您可以打开工具并以交互方式选择变量,或指定初始适合变量
cftool.命令。E.Nter the following to open Curve Fitting app (if necessary) and create a new response surface for
Algomicry.:cftool.(Propofol, Remifentanil, Algometry)
查看曲线拟合应用程序
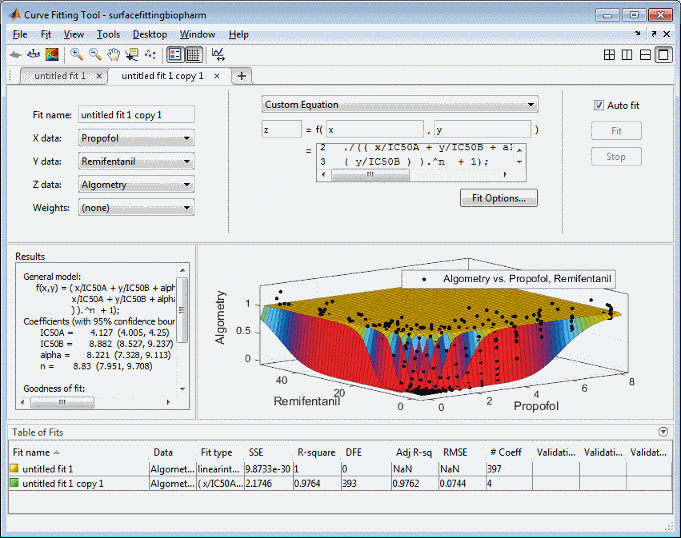
X那y那andZ.输入和输出控制。该工具显示所选变量Propofol那RemifentanilandAlgomicry.那with a surface fit. The default fit is an interpolating surface that passes through the data points.
Create a copy of the current surface fit by either:
选择Fit>Duplicate
"Current Fit Name"。右键单击适合的适合表,选择Duplicate。
选择the自定义方程式fit type from the drop-down list to define your own equation to fit the data.
选择and delete the example custom equation text in the edit box.
您可以使用自定义方程式编辑框进入MATLAB代码以定义您的模型。定义模型的等式必须依赖于输入变量
Xandy以及固定参数,可估计参数或两者的列表。The model from the paper is:
其中C.一种and CB.是药物浓度,IC50A,IC50B,α和N是估计的系数。
您可以在MATLAB代码中定义此项
效果= Emax *(CA / IC50A + CB / IC50B + Alpha *(CA / IC50A).... *(CB / IC50B))。^ N ./((CA / IC50A + CB / IC50B + ... Alpha*(CA / IC50A)。*(CB / IC50B))。^ n + 1);
讲述变量适合的工具以及要估计的参数,需要重写变量名称
加利福尼亚州andCB.至X那andy。你必须包括Xandywhen you enter a custom equation in the edit box. AssumeE.max = 1因为效果输出归一化。在自定义方程式编辑框中输入以下文本。
(X / IC50A + Y / IC50B + Alpha *(X / IC50A)。*(Y / IC50B))。^ n ./((X / IC50A + Y / IC50B + Alpha *(X / IC50A)。*(y/ IC50B))。^ n + 1);
Curve Fitting app fits a surface to the data using the custom equation model.

组some of the fit options by clickingFit Optionsunder your custom equation.
在“拟合选项”对话框中:
组Robust至
Lar设定α起点至1and lower bound to –5.

Leave the other defaults, and click关。
The tool refits with your new options.
点评审查Results窗格。查看(以及可选地,复制)其中任何结果:
模型方程
估计系数的值
The goodness-of-fit statistics
Display the residuals plot to check the distribution of points relative to the surface by clicking the toolbar button
 or selecting视图>残差情节。
To generate code for all fits and plots in your Curve Fitting app session, selectFile>Generate Code。
曲线拟合应用程序从您的会话生成代码,并在MATLAB编辑器中显示该文件。该文件包括当前会话中的所有适合和绘图。
使用默认名称保存文件,
Createfits.m.。您可以通过从命令行调用文件(使用您的原始数据或输入参数)来重新创建符合和图。在这种情况下,您的原始数据仍然显示在工作区中。
突出显示文件的第一行(不包括单词)
function)那and evaluate it by either right-clicking and selecting评估命令窗口中的选择,按下F9.那or copying and pasting the following to the command line:[fitresult, gof] = createFits(Propofol,... Remifentanil, Algometry)
The function creates a figure window for each fit you had in your session. The custom fit figure shows both the surface and residuals plots that you created interactively in the Curve Fitting app.
通过输入,创建一个新的拟合tetany响应而不是alborry:
[fitresult, gof] = createFits(Propofol,... Remifentanil, Tetany)
如果您希望图表上的新响应标签,则需要编辑文件。您可以使用生成的代码作为更改表面适合和绘图以满足您需求的起点。有关您可以使用的方法列表,请参阅
SFIT.。
To see how to programmatically fit surfaces to the same example problem, see用自定义方程式拟合到生物制药数据。


