比较曲线拟合应用程序的适合
互动曲线拟合工作流程
下一个主题使用多项式方程符合第六度的一些人口普查数据,以及单级指数方程。这些步骤展示了如何:
使用不同的库模型加载数据并探索各种适合。
搜索最适合:
比较图形拟合结果
比较数值拟合结果,包括拟合系数和拟合统计数据
将您的最佳拟合结果导出到Matlab®workspace to analyze the model at the command line.
Save the session and generate MATLAB code for all fits and plots.
加载数据并创建适合
您必须在使用曲线拟合应用程序拟合数据之前将数据变量加载到MATLAB工作区中。对于此示例,数据存储在MATLAB文件中census.mat。
Load the data:
负载普查
工作区包含两个新变量:
Cdate.is a column vector containing the years 1790 to 1990 in 10-year increments.pop是与美国人口数据相对应的栏目矢量Cdate.。
打开曲线拟合应用程序:
cftool.
选择the variable names
Cdate.andpop来自x数据andy数据lists.曲线拟合应用程序创建并绘制默认适合X输入(或预测器数据)和Y输出(或响应数据)。默认合适是线性多项式配合类型。遵守拟合设置显示
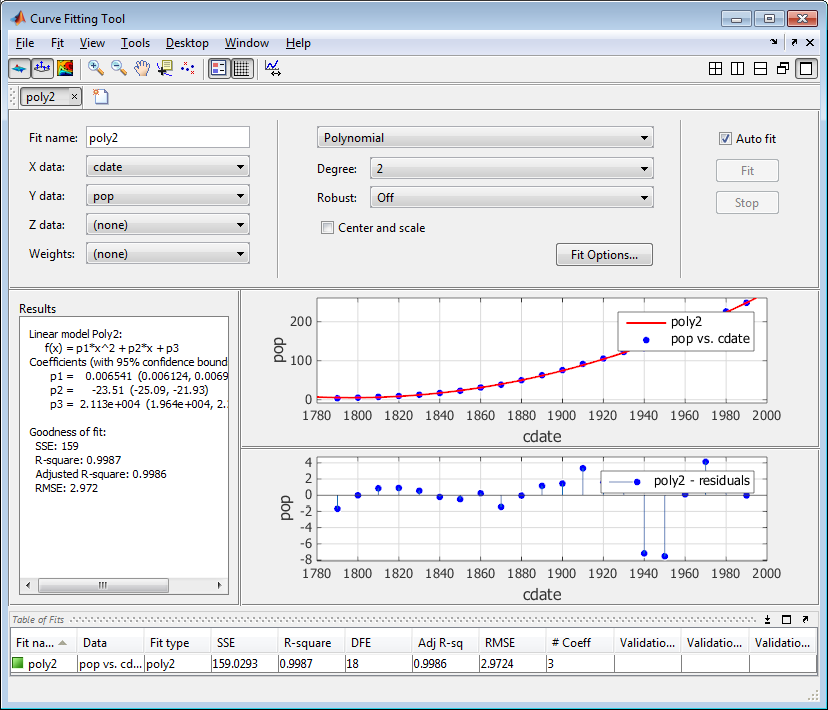
多项式,度1。通过选择将拟合变为二级多项式
2来自度list.曲线拟合应用程序绘制新的合适。曲线拟合应用程序在更改拟合设置时计算新拟合,因为一种uto fitis selected by default. If refitting is time consuming, e.g., for large data sets, you can turn off一种uto fit通过清除复选框。
该Curve Fitting app displays results of fitting the census data with a quadratic polynomial in theR.esults窗格,您可以在其中查看库模型,装配系数,以及拟合统计数据。
Change the适合名称至
poly2。通过选择来显示残差视图>残差情节。
残差表明可能是更好的拟合。因此,继续探索各种适合人口普查数据集。
添加新的配合以尝试其他库方程。
右键单击拟合适合表并选择重复“
poly2“(或使用Fit菜单)。小费
对于给定类型的配合(例如,多项式),使用重复“
fitname“instead of a new fit because copying a fit requires fewer steps. The duplicated fit contains the same data selections and fit settings.改变多项式度至
3.and rename the fitpoly3。当你融合更高的多项式时,R.esults窗格显示此警告:
方程式很厉害。删除重复的数据点或尝试居中和缩放。
通过选择来标准化数据中心和比例复选框。
重复步骤A和B以添加多项式符合第六度,然后添加指数拟合。
对于每个新的合适,看看R.esultspane information, and the residuals plot in the Curve Fitting app.
该residuals from a good fit should look random with no apparent pattern. A pattern, such as a tendency for consecutive residuals to have the same sign, can be an indication that a better model exists.

关于Scaling
关于缩放的警告是因为拟合程序使用Cdate.values as the basis for a matrix with very large values. The spread of theCdate.值导致缩放问题。要解决此问题,您可以规范化Cdate.数据。归一化缩放预测数据以提高后续数字计算的准确性。一种规范化的方法Cdate.is to center it at zero mean and scale it to unit standard deviation. The equivalent code is:
(Cdate - 平均值(Cdate))./ Std(Cdate)
注意
因为预测器数据在归一化之后改变,所以与原始数据相比,拟合系数的值也会改变。然而,数据的功能形式和由此产生的拟合统计数据不会改变。此外,数据显示在使用原始比例的曲线拟合应用程序图中。
确定最合适的
To determine the best fit, you should examine both the graphical and numerical fit results.
检查图形拟合结果
通过检查适合和残差的图形来确定最佳拟合。要依次查看每个配合的图,请双击适合表中的拟合。图形拟合结果表明:
多项式方程的拟合和残留物都是相似的,使得难以选择最好的。
该fit and residuals for the single-term exponential equation indicate it is a poor fit overall. Therefore, it is a poor choice and you can remove the exponential fit from the candidates for best fit.
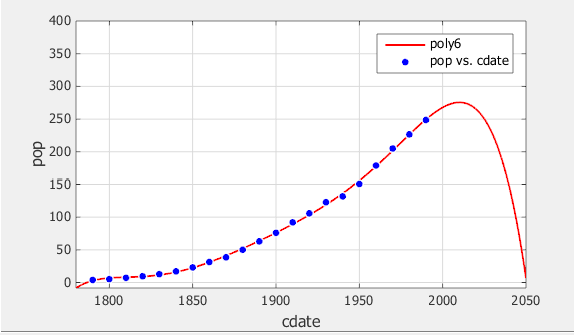
审查适合于2050年的行为。拟合人口普查数据的目标是推断最适合预测未来人口价值的目标。
双击适合表中的第六度多项式适合,以查看这种合适的图。
Change the axes limits of the plots by selectingTools>一种xes Limits。
改变x(Cdate)Maximum至
2050.那and increase theMain Y (pop)Maximum至400那and press输入。检查适合情节。六程度多项式拟合超出数据范围的行为使其成为外推的良好选择,您可以拒绝这种合适。

评估数值拟合结果
当您不能再通过图形检查它们来消除FITS时,您应该检查数值拟合结果。曲线配件应用程序显示两种类型的数值拟合结果:
Goodness-of-fit statistics
Confidence bounds on the fitted coefficients
该善意-of-fit statistics help you determine how well the curve fits the data. The confidence bounds on the coefficients determine their accuracy.
检查数值拟合结果:
对于每个符合,查看符合健康统计数据R.esultspane.

将所有适合同时比较适合表。单击列标题以按统计结果排序。

检查因错误(SSE)和调整后的平方和R.-Square统计数据,以帮助确定最合适。SSE统计是拟合的最小二乘误差,其值更接近零表示更好的拟合。调整后R.-Square统计通常是您为模型添加额外系数时拟合质量的最佳指标。
该largest SSE for
exp1表示它是一种糟糕的契合,您已经通过检查拟合和残留物来确定。最低的SSE值与poly6。However, the behavior of this fit beyond the data range makes it a poor choice for extrapolation, so you already rejected this fit by examining the plots with new axis limits.下一个最佳的SSE值与第五型多项式合适相关,
poly5那suggesting it might be the best fit. However, the SSE and adjustedR.-square values for the remaining polynomial fits are all very close to each other. Which one should you choose?通过检查结果窗格中剩余适合的置信度界限解决最佳拟合问题。双击适合适合表打开(或焦点已打开)适合图并查看结果窗格。一种fit figuredisplays the fit settings, results pane and plots for a single fit.
显示第五程度多项式和
poly2fit figures side by side. Examining results side by side can help you assess fits.要同时显示两个拟合图,请使用曲线拟合应用的右上角的布局控制或选择窗口>Left/Right Tileor顶部/底部瓷砖。
要更改显示的适合,请单击以选择适合图,然后双击“适合”以显示适合表。
比较系数和界限(
p1那p2等等的,依此类推,窗格都适合,poly5andpoly2。工具箱计算系数的95%置信范围。系数上的置信度界限决定了它们的准确性。检查结果窗格中的方程式(f(x)= p1 * x + p2 * x。。。) to see the model terms for each coefficient. Note thatp2指的是p2 * x.术语Poly2和p2 * x.^4术语Poly5.。Do not compare normalized coefficients directly with non-normalized coefficients.小费
使用视图隐藏的菜单适合设置or适合表if you want more space to view and compare plots and results, as shown next. You can also hide theR.esultspane to show only plots.

该bounds cross zero on the
p1那p2那andp3coefficients for the fifth-degree polynomial. This means you cannot be sure that these coefficients differ from zero. If the higher order model terms may have coefficients of zero, they are not helping with the fit, which suggests that this model overfits the census data.
However, the small confidence bounds do not cross zero on
p1那p2那andp3对于二次适合,poly2表明拟合系数相当准确地知道。
因此,在检查图形和数值拟合结果后,您应该选择
poly2as the best fit to extrapolate the census data.


注意
对于每个归一化多项式方程,与常数,线性和二次术语相关联的拟合系数几乎相同。然而,随着多项式程度的增加,与高度术语相关的系数边界交叉零,这表明过度拟合。
分析您在工作区中最合适的
You can use保存到工作区至export the selected fit and the associated fit results to the MATLAB workspace. The fit is saved as a MATLAB object and the associated fit results are saved as structures.
右键单击
poly2适合适合表并选择Save “poly2” to Workspace(或使用Fit菜单)。
点击OK使用默认名称保存。
该
fittedmodel被保存为曲线拟合工具箱™CFIT.object.>> Whos Fittedmodel名称大小字节字节类FittedModel 1x1 822 CFIT

Examine thefittedmodelCFIT.object to display the model, the fitted coefficients, and the confidence bounds for the fitted coefficients:
Fittedmodel fittedmodel =线性模型Poly2:Fittedmodel(x)= p1 * x ^ 2 + p2 * x + p3系数(具有95%的置信度):p1 = 0.006541(0.006124,0006958)p2 = -23.51(-25.09,-21.93)p3 = 2.113e + 004(1.964E + 004,2.262E + 004)
Examine the善意结构显示良好结果:
GOODNEST BOYNANDENT = SSE:159.0293 RSQUARE:0.9987 DFE:18 ADJRSQUARE:0.9986 RMSE:2.9724
Examine the输出结构显示与拟合相关联的附加信息,例如残差:
输出输出= numobs:21 numparam:3残差:[21x1 double] jacobian:[21x3 double] extflag:1算法:'qr分解和解决'迭代:1
您可以在具有各种后处理功能的指定数据范围内进行评估(插入或推断),分辨或集成拟合。
例如,评估fittedmodelat a vector of values to extrapolate to the year 2050, enter:
Y = FittedModel(2000:10:2050)y = 274.6221 301.8240 330.3341 360.1524 391.2790 423.7137
plot(fittedmodel, cdate, pop) hold on plot(fittedmodel, 2000:10:2050, y) hold off
有关使用命令行的示例再现此交互式人口普查数据分析,请参阅多项式曲线配件。
拯救你的工作
Toolbox提供了一些可用于保存工作的选项。您可以将一个或多个适合和关联的拟合结果作为变量保存为Matlab工作区。然后,您可以使用此保存的信息进行文档目的,或扩展数据探索和分析。除了将工作保存到Matlab工作区变量外,您还可以:
通过选择保存当前曲线拟合会话File>保存会议。会话文件包含会话中的所有适合和变量,并记得您的布局。看到保存和重新加载会话。
生成MATLAB代码重新创建所有适合和阴谋s in your session by selectingFile>Generate Code。该Curve Fitting app generates code from your session and displays the file in the MATLAB Editor.
You can recreate your fits and plots by calling the file at the command line with your original data as input arguments. You can also call the file with new data, and automate the process of fitting multiple data sets. For more information, seeGenerating Code from the Curve Fitting App。
R.elated Topics
You can also select a web site from the following list:
美洲
- 一种mérica Latina(Español)
- 加拿大(英语)
- 美国(英语)