uitable
Create table user interface component
Description
uit= uitableTableUI component object. If there is no figure available, MATLAB®calls thefigurefunction to create one.
uit= uitable(Name,Value)
uit= uitable(父)figureoruifigurefunction, or a child container such as a panel. Property values foruitablevary slightly depending on whether the app is created with thefigureoruifigurefunction. For more information, seeName-Value Pair Arguments.
uit= uitable(父,Name,Value)
Examples
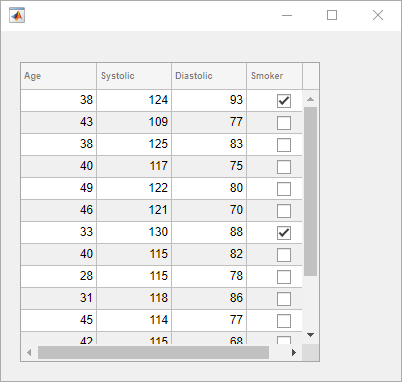
Display Table Array Data
Starting in R2018a, you can displaytablearray data in a table UI component. This type of data is supported only when the table UI component is in a figure created with theuifigurefunction. App Designer uses this type of figure for creating apps.
Create table arraytby calling thereadtablefunction to read data from a file. Select four variables and 15 rows fromt.
t = readtable('patients.xls'); vars = {'Age','Systolic','Diastolic','Smoker'}; t = t(1:15,vars);
Create a table UI component, and specifytas the data.
fig = uifigure; uit = uitable(fig,'Data',t);
Update Visualizations for Sorted Display Data
Starting in R2019a, you can sort the columns of a table UI component that hastablearray data stored in itsDataproperty. This type of data is supported only when the table UI component is in a figure created with theuifigurefunction. App Designer uses this type of figure for creating apps.
Displaytablearray data and update the plot when a user sorts the columns or edits the cells.
First, create a program file calledtsunamisData.m. Within the program file:
Create a
tablearray by calling thereadtablefunction.Create a sortable and editable table UI component to display in a figure. Store the
tablearray to component'sDataproperty.Specify a
DisplayDataChangedFcncallback that uses theDisplayDataproperty to update the plot when a user sorts columns or edits cells in the table UI component.
functiontsunamisData t = readtable('tsunamis.xlsx'); vars = {'Year','MaxHeight','Latitude','Longitude'}; t = t(1:20,vars); fig = uifigure; fig.Position(3:4) = [822 360]; uit = uitable(fig); uit.Data = t; uit.ColumnSortable = [false true true true]; uit.ColumnEditable = true; uit.Position(3) = 375; uit.DisplayDataChangedFcn = @updatePlot; ax = uiaxes(fig); ax.Position(1) = 415; ax.YLabel.String ='Max Height'; x = t.Year; y = t.MaxHeight; area(ax,x,y)functionupdatePlot(src,event) t = uit.DisplayData; x = t.Year; y = t.MaxHeight; area(ax,x,y)endend

A sortable column displays arrows in the header when you hover your mouse over it. Find a sortable column and sort the table. Notice how the displayed data and the plot update after sorting.

Add Style to Specific Cells in Table
Starting in R2019b, you can style rows, columns, or cells of a table UI component using theuistyleandaddStylefunctions. Styles are only supported when the table UI component is in a figure created with theuifigurefunction. App Designer uses this type of figure for creating apps.
风格细胞选项卡le UI component that contain missing values. In this case, add a yellow background color style to cells that haveNaNvalues.
Read tsunami sample data into the workspace as a table array. Then, create a table UI component to display the data.
tdata = readtable('tsunamis.xlsx'); vars = {'Year','Month','Day','Hour',...'MaxHeight','Cause','EarthquakeMagnitude'}; tdata = tdata(1:100,vars); fig = uifigure('Position',[500 500 750 350]); uit = uitable(fig); uit.Position = [20 20 710 310]; uit.Data = tdata; uit.RowName ='numbered';
Use theismissingfunction to get a logical array of the table elements that contain missing values. Find the row and column subscripts for the elements that haveNaNvalues. Finally, create a yellow background color style and add it to the cells withNaNvalues in the table UI component.
styleIndices = ismissing(tdata); [row,col] = find(styleIndices); s = uistyle('BackgroundColor','yellow'); addStyle(uit,s,'cell',[row,col]);

Display Array of Numbers
Create a table UI component that displays a 10-by-3 array of random integers. TheDataproperty specifies the values to display, and thePositionproperty specifies the location and size of the table within the figure.
f = figure; uit = uitable(f,'Data',randi(100,10,3),'Position',[20 20 262 204]);

Display Mixed Data Types
Table UI components can accommodate a mixture of different data types across the columns.
Create an emptyTableUI component.
f = figure; uit = uitable(f);
Set theDataproperty to populate the data as a cell array that contains a mixture of different types. Then set thePositionproperty to adjust the location and size of the table to fit the data.
d = {“男”,52,true;“男”,40,true;'Female',25,false}; uit.Data = d; uit.Position = [20 20 258 78];

Set theColumnNameproperty to change the column headings to descriptive names. Set theColumnEditableproperty totrueso that users can edit the data in the UI. When a user changes a value in the UI, theDataproperty updates to reflect that change.
uit.ColumnName = {'Gender','Age','Authorized'}; uit.ColumnEditable = true;

Input Arguments
See Also
Functions
Properties
Select a Web Site
Choose a web site to get translated content where available and see local events and offers. Based on your location, we recommend that you select:.
Selectweb siteYou can also select a web site from the following list:
Americas
- América Latina(Español)
- Canada(English)
- United States(English)
Europe
- Belgium(English)
- Denmark(English)
- Deutschland(Deutsch)
- España(Español)
- Finland(English)
- France(Français)
- Ireland(English)
- Italia(Italiano)
- Luxembourg(English)
- Netherlands(English)
- Norway(English)
- Österreich(Deutsch)
- Portugal(English)
- Sweden(English)
- Switzerland
- United Kingdom(English)