IGBT Thermal Characteristics
This example shows generation of the Ic versus Vce curve for an IGBT at two different temperatures. To generate the plot, click on the hyperlink in the model labeled 'Plot IGBT curves'.
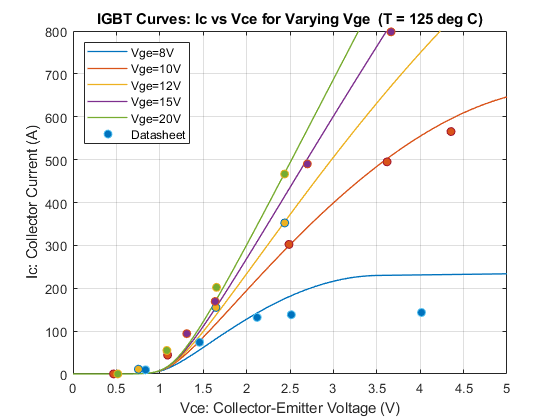
On the plot, the solid lines are from running the model, and the dotted lines are digitized datasheet data. The N-Channel IGBT component has been parameterized using Vce values for when Ic is 400A and Vge is 10V. These two points are intercepted by both model and datasheet plots for Vge=10V. The remaining block parameters must be tuned by simulation so that the datasheet and model plots match as best as is possible. See the N-Channel IGBT block reference page for further information.
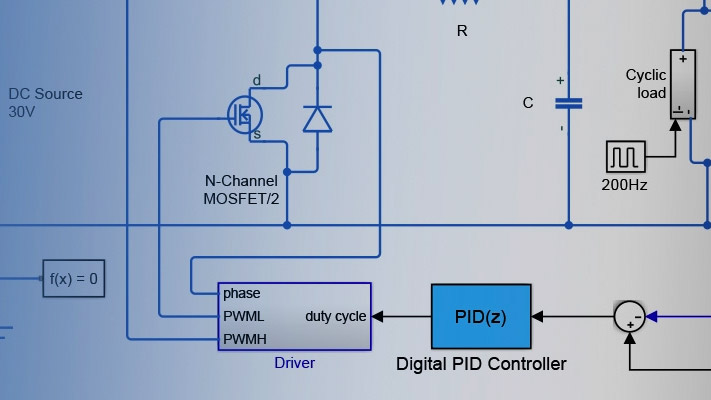
Model

Simulation Results from Simscape Logging
The plot below shows the collector current vs collector-emitter voltage characteristics for a range of gate-emitter voltages. The tests are run at two different temperatures. The results are compared to data points obtained from a manufacturer's data sheet.
You can digitize datasheet information using tools available on MATLAB® Central File Exchange://www.tatmou.com/matlabcentral/, such as GRABIT [1].

References
jiro (2019). GRABIT (//www.tatmou.com/matlabcentral/fileexchange/7173-grabit), MATLAB Central File Exchange. Retrieved December 16, 2019.
Select a Web Site
Choose a web site to get translated content where available and see local events and offers. Based on your location, we recommend that you select:.
Selectweb siteYou can also select a web site from the following list:
Americas
- América Latina(Español)
- Canada(English)
- United States(English)
Europe
- Belgium(English)
- Denmark(English)
- Deutschland(Deutsch)
- España(Español)
- Finland(English)
- France(Français)
- Ireland(English)
- Italia(Italiano)
- Luxembourg(English)
- Netherlands(English)
- Norway(English)
- Österreich(Deutsch)
- Portugal(English)
- Sweden(English)
- Switzerland
- United Kingdom(English)