SimFunctionSensitivity object
SimFunctionSensitivity object, subclass ofSimFunctionobject
Description
TheSimFunctionSensitivityobject is a subclass ofSimFunction object. It allows you to compute sensitivity.
Syntax
TheSimFunctionSensitivityobject shares all syntaxes of theSimFunctionobject. It has the following additional syntax.
[T,Y,SensMatrix] = F(___)returnsT, a cell array of numeric vector,Y, a cell array of 2-D numeric matrices, andSensMatrix, a cell array of 3-D numeric matrix containing calculated sensitivities of model quantities.SensMatrixcontains a matrix of sizeTimePointsxOutputsxInputs.TimePointsis the total number of time points,Outputsis the total number of output factors, andInputsis the total number of input factors.
If you specify a single output argument, the object returns anSimDataobject or array ofSimDataobjects with sensitivity information.
Properties
TheSimFunctionSensitivityobject shares all properties of theSimFunction object. It has the following additional properties.
SensitivityOutputs |
This table contains information about model quantities (species or parameters) for which you want to compute the sensitivities. Sensitivity output factors are the numerators of time-dependent derivatives described inSensitivity Analysis in SimBiology. This property is read only. |
SensitivityInputs |
This table contains information about model quantities (species, compartments, or parameters) with respect to which you want to compute the sensitivities. Sensitivity input factors are the denominators of time-dependent derivatives described inSensitivity Analysis in SimBiology. This property is read only. |
SensitivityNormalization |
Character vector specifying the normalization method for calculated sensitivities. The following examples show how sensitivities of a speciesxwith respect to a parameterkare calculated for each normalization type.
|
Examples
Calculate Sensitivities UsingSimFunctionSensitivityObject
This example shows how to calculate the sensitivities of some species in the Lotka-Volterra model using theSimFunctionSensitivityobject.
Load the sample project.
sbioloadprojectlotka;
Define the input parameters.
params = {'Reaction1.c1','Reaction2.c2'};
Define the observed species, which are the outputs of simulation.
observables = {'y1','y2'};
创建一个SimFunctionSensitivityobject. Set the sensitivity output factors to all species (y1andy2) specified in theobservablesargument and input factors to those in theparamsargument (c1andc2) by setting the name-value pair argument to'all'.
f = createSimFunction(m1,params,observables,[],'SensitivityOutputs','all','SensitivityInputs','all','SensitivityNormalization','Full')
f = SimFunction Parameters: Name Value Type ________________ _____ _____________ {'Reaction1.c1'} 10 {'parameter'} {'Reaction2.c2'} 0.01 {'parameter'} Observables: Name Type ______ ___________ {'y1'} {'species'} {'y2'} {'species'} Dosed: None Sensitivity Input Factors: Name Type ________________ _____________ {'Reaction1.c1'} {'parameter'} {'Reaction2.c2'} {'parameter'} Sensitivity Output Factors: Name Type ______ ___________ {'y1'} {'species'} {'y2'} {'species'} Sensitivity Normalization: Full
Calculate sensitivities by executing the object withc1andc2set to 10 and 0.1, respectively. Set the output times from 1 to 10.tcontains time points,ycontains simulation data, andsensMatrixis the sensitivity matrix containing sensitivities ofy1andy2with respect toc1andc2.
[t,y,sensMatrix] = f([10,0.1],[],[],1:10);
Retrieve the sensitivity information at time point 5.
temp = sensMatrix{:}; sensMatrix2 = temp(t{:}==5,:,:); sensMatrix2 = squeeze(sensMatrix2)
sensMatrix2 =2×237.6987 -6.8447 -40.2791 5.8225
The rows ofsensMatrix2represent the output factors (y1andy2). The columns represent the input factors (c1andc2).
Set the stop time to 15, without specifying the output times. In this case, the output times are the solver time points by default.
sd = f([10,0.1],15);
Retrieve the calculated sensitivities from theSimDataobjectsd.
[t,y,outputs,inputs] = getsensmatrix(sd);
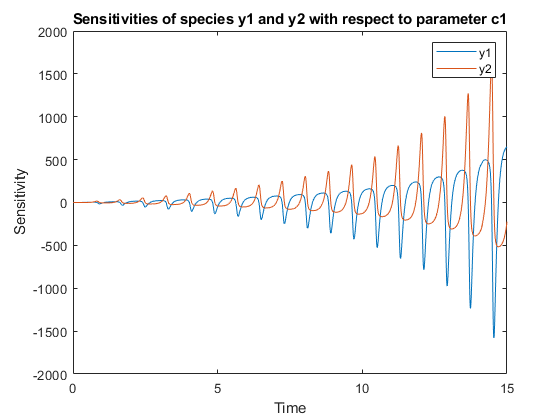
Plot the sensitivities of speciesy1andy2with respect toc1.
figure; plot(t,y(:,:,1)); legend(outputs); title('Sensitivities of species y1 and y2 with respect to parameter c1'); xlabel('Time'); ylabel('Sensitivity');
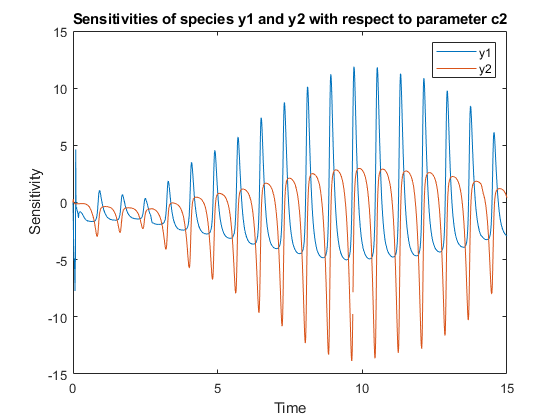
Plot the sensitivities of speciesy1andy2with respect toc2.
figure; plot(t,y(:,:,2)); legend(outputs); title('Sensitivities of species y1 and y2 with respect to parameter c2'); xlabel('Time'); ylabel('Sensitivity');
Alternatively, you can usesbioplot.
sbioplot(sd);
![Figure contains an axes object. The axes object with title States versus Time contains 6 objects of type line. These objects represent y1, y2, d[y1]/d[Reaction1.c1], d[y2]/d[Reaction1.c1], d[y1]/d[Reaction2.c2], d[y2]/d[Reaction2.c2].](http://www.tatmou.com/help/examples/simbio/win64/CalculateSensitivitiesUsingSimFunctionSensitivityObjectExample_03.png)
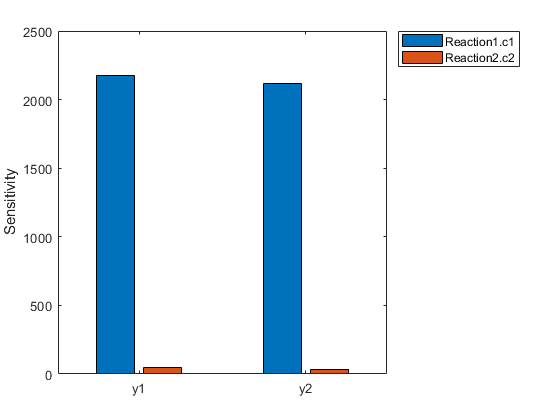
You can also plot the sensitivity matrix using the time integral for the calculated sensitivities ofy1andy2. The plot indicatesy1andy2are more sensitive toc1thanc2.
[~, in, out] = size(y); result = zeros(in, out);fori = 1:inforj = 1:out result(i,j) = trapz(t(:),abs(y(:,i,j)));endendfigure; hbar = bar(result); haxes = hbar(1).Parent; haxes.XTick = 1:length(outputs); haxes.XTickLabel = outputs; legend(inputs,'Location','NorthEastOutside'); ylabel('Sensitivity');
Version History
You can also select a web site from the following list:
Americas
- América Latina(Español)
- Canada(English)
- United States(English)
Europe
- Belgium(English)
- Denmark(English)
- Deutschland(Deutsch)
- España(Español)
- Finland(English)
- France(Français)
- Ireland(English)
- Italia(Italiano)
- Luxembourg(English)
- Netherlands(English)
- Norway(English)
- Österreich(Deutsch)
- 葡萄牙(English)
- Sweden(English)
- Switzerland
- United Kingdom(English)