Plot Posterior Classification Probabilities
This example shows how to visualize posterior classification probabilities predicted by a naive Bayes classification model.
Load Fisher's iris data set.
loadfisheririsX = meas(:,1:2); Y = species; labels = unique(Y);
Xis a numeric matrix that contains two petal measurements for 150 irises.Yis a cell array of character vectors that contains the corresponding iris species.
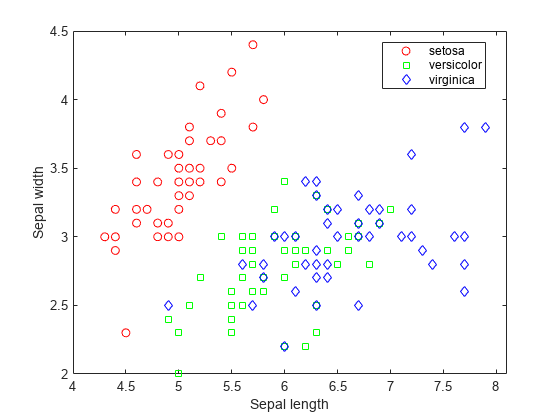
Visualize the data using a scatter plot. Group the variables by iris species.
figure; gscatter(X(:,1), X(:,2), species,“rgb”,'osd'); xlabel(“花萼长度”); ylabel('Sepal width');
Train a naive Bayes classifier.
mdl = fitcnb(X,Y);
mdlis a trainedClassificationNaiveBayesclassifier.
Create a grid of points spanning the entire space within some bounds of the data. The data inX(:,1)ranges between 4.3 and 7.9. The data inX(:,2)ranges between 2 and 4.4.
[xx1, xx2] = meshgrid(4:.01:8,2:.01:4.5); XGrid = [xx1(:) xx2(:)];
Predict the iris species and posterior class probabilities of each observation inXGridusingmdl.
[predictedspecies,Posterior,~] = predict(mdl,XGrid);
Plot the posterior probability distribution for each species.
sz = size(xx1); s = max(Posterior,[],2); figure holdonsurf(xx1,xx2,reshape(Posterior(:,1),sz),'EdgeColor','none') surf(xx1,xx2,reshape(Posterior(:,2),sz),'EdgeColor','none') surf(xx1,xx2,reshape(Posterior(:,3),sz),'EdgeColor','none') xlabel(“花萼长度”); ylabel('Sepal width'); colorbar view(2) holdoff
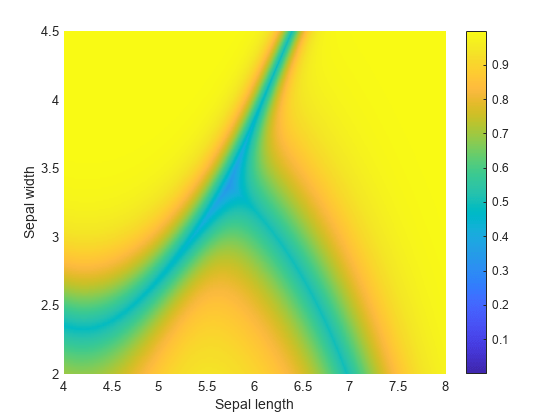
The closer an observation gets to the decision surface, the less probable it is that the data belongs to a certain species.
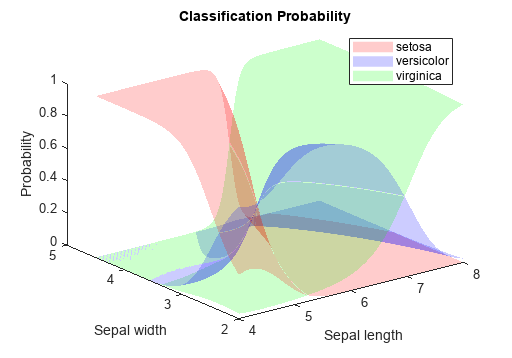
Plot the classification probability distributions individually.
figure('Units','Normalized','Position',[0.25,0.55,0.4,0.35]); holdonsurf(xx1,xx2,reshape(Posterior(:,1),sz),'FaceColor','red','EdgeColor','none') surf(xx1,xx2,reshape(Posterior(:,2),sz),'FaceColor','blue','EdgeColor','none') surf(xx1,xx2,reshape(Posterior(:,3),sz),'FaceColor','green','EdgeColor','none') xlabel(“花萼长度”); ylabel('Sepal width'); zlabel('Probability'); legend(labels) title('Classification Probability') alpha(0.2) view(3) holdoff
See Also
Functions
Objects
Related Topics
You can also select a web site from the following list:
Americas
- América Latina(Español)
- Canada(English)
- United States(English)
Europe
- Belgium(English)
- Denmark(English)
- Deutschland(Deutsch)
- España(Español)
- Finland(English)
- France(Français)
- Ireland(English)
- Italia(Italiano)
- Luxembourg(English)
- Netherlands(English)
- Norway(English)
- Österreich(Deutsch)
- Portugal(English)
- Sweden(English)
- Switzerland
- United Kingdom(English)