Main Content
View Decision Tree
This example shows how to view a classification or regression tree. There are two ways to view a tree:view(tree)returns a text description andview(tree,'mode','graph')returns a graphic description of the tree.
Create and view a classification tree.
loadfisheriris% load the sample datactree = fitctree(meas,species);% create classification treeview(ctree)% text description
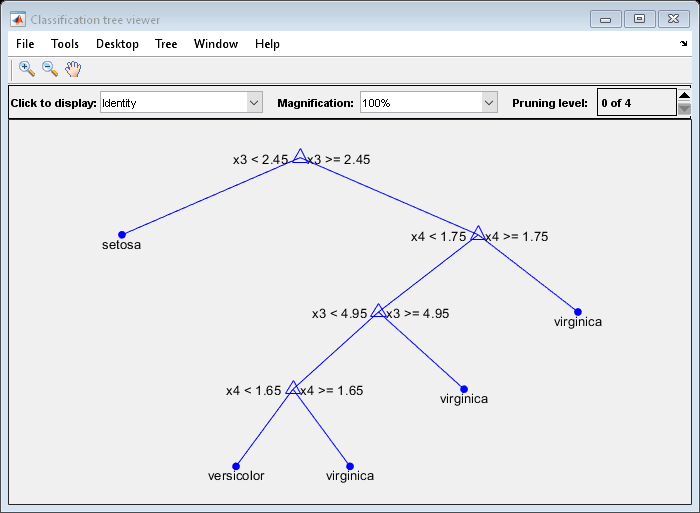
Decision tree for classification 1 if x3<2.45 then node 2 elseif x3>=2.45 then node 3 else setosa 2 class = setosa 3 if x4<1.75 then node 4 elseif x4>=1.75 then node 5 else versicolor 4 if x3<4.95 then node 6 elseif x3>=4.95 then node 7 else versicolor 5 class = virginica 6 if x4<1.65 then node 8 elseif x4>=1.65 then node 9 else versicolor 7 class = virginica 8 class = versicolor 9 class = virginica
view(ctree,'mode','graph')% graphic description
Now, create and view a regression tree.
loadcarsmall% load the sample data, contains Horsepower, Weight, MPGX = [Horsepower Weight]; rtree = fitrtree(X,MPG,'MinParent',30);% create classification treeview(rtree)% text description
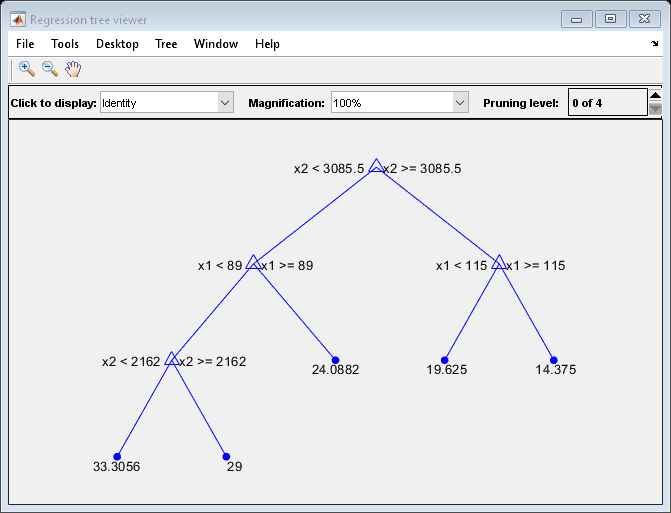
Decision tree for regression 1 if x2<3085.5 then node 2 elseif x2>=3085.5 then node 3 else 23.7181 2 if x1<89 then node 4 elseif x1>=89 then node 5 else 28.7931 3 if x1<115 then node 6 elseif x1>=115 then node 7 else 15.5417 4 if x2<2162 then node 8 elseif x2>=2162 then node 9 else 30.9375 5 fit = 24.0882 6 fit = 19.625 7 fit = 14.375 8 fit = 33.3056 9 fit = 29
view(rtree,'mode','graph')% graphic description
See Also
fitctree|fitrtree|view (CompactClassificationTree)|view (CompactRegressionTree)
Related Topics
Select a Web Site
Choose a web site to get translated content where available and see local events and offers. Based on your location, we recommend that you select:.
Selectweb siteYou can also select a web site from the following list:
Americas
- América Latina(Español)
- Canada(English)
- United States(English)
Europe
- Belgium(English)
- Denmark(English)
- Deutschland(Deutsch)
- España(Español)
- Finland(English)
- France(Français)
- Ireland(English)
- Italia(Italiano)
- Luxembourg(English)
- Netherlands(English)
- Norway(English)
- Österreich(Deutsch)
- Portugal(English)
- Sweden(English)
- Switzerland
- United Kingdom(English)