Color along line in polaraxes
1 view (last 30 days)
Show older comments
I am trying to combine two "solved" aspects of MATLAB -- 1) plotting a 2D line with color that varies along the line in 2) polar axes.
The first part is usually easy, and frequently asked:
//www.tatmou.com/matlabcentral/answers/5042-how-do-i-vary-color-along-a-2d-line
or
https://stackoverflow.com/questions/8559133/how-to-vary-the-line-color-of-a-matlab-plot-like-colormap
The most commonly suggested trick is to use
surf
or
mesh
to create a "fake" 3D line and color this. However, this is not supported on
polaraxes
in MATLAB:
>> polaraxes, holdon;
>> surf([1 1; 1 1], [2 2; 2 2], [3 3; 3 3])
Errorusing newplot (line 80)
AddingCartesian plot to polaraxes is not supported
One trick that
does
seem to work is using a sequence of line segments, as is done in
cline.m
from File Exchange.
>> polaraxes; holdon; cline;
Gives this
which is technically what I want... but as pointed out in the previous comments, is much uglier than the solution with surf or mesh since it draws individual segments.
Is there any other way to do this? I found this question also asked here
//www.tatmou.com/matlabcentral/answers/439176-how-do-i-vary-the-color-along-a-line-in-polar-coordinates
with an "accepted answer" that this does not seem possible, so I'm feeling a little pessimistic.
0 Comments
Accepted Answer
Chad Greene
on 5 May 2021
Edited:Chad Greene
on 5 May 2021
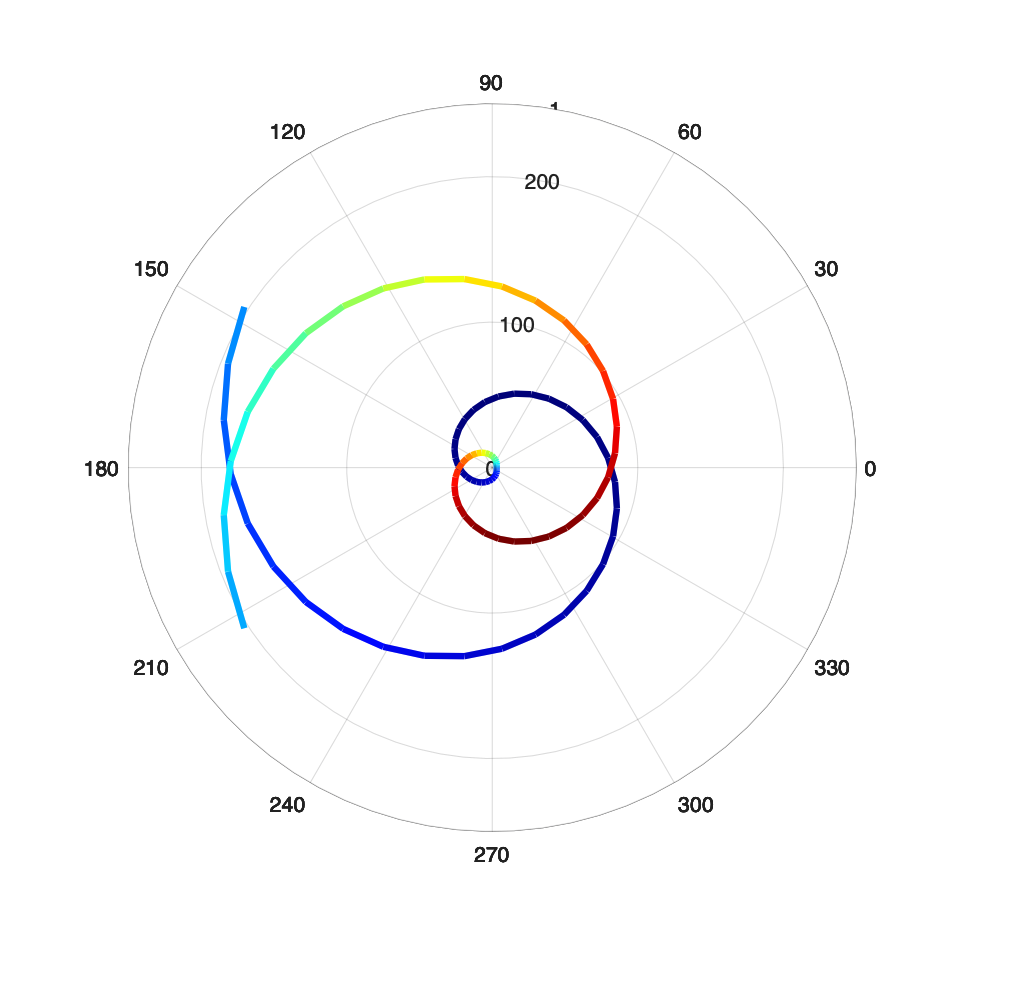
I'm thinking something like this:
theta = linspace(0,6*pi,100000);
rho1 = theta/10;
polarscatter(theta,rho1,5,rho1,'filled')
More Answers (0)
See Also
Community Treasure Hunt
Find the treasures in MATLAB Central and discover how the community can help you!
Start Hunting!