编者按:这个文件被选为MATLAB中心推荐商品
zip文件包含以下用于可视化发行版的文件:
——distributionPlot。主要功能是创造小提琴的情节
——myHistogram。m:在给定数据点数量和分布的情况下,生成具有“理想”bin宽度的直方图(弗里德曼-迪亚康规则)。注意,对于整数值数据,每个整数都有自己的bin。
此外,zip文件包含四个助手函数:countries, colorCode2rgb, isEven, myErrorbar
如果要覆盖单个数据点,则需要下载单独的提交plotSpread(//www.tatmou.com/matlabcentral/fileexchange/37105).
DistributionPlot允许并排显示多个分布。它对倾斜的单峰数据有用,对多峰数据必不可少。DistributionPlot对于显示分布的时间演化特别有用。
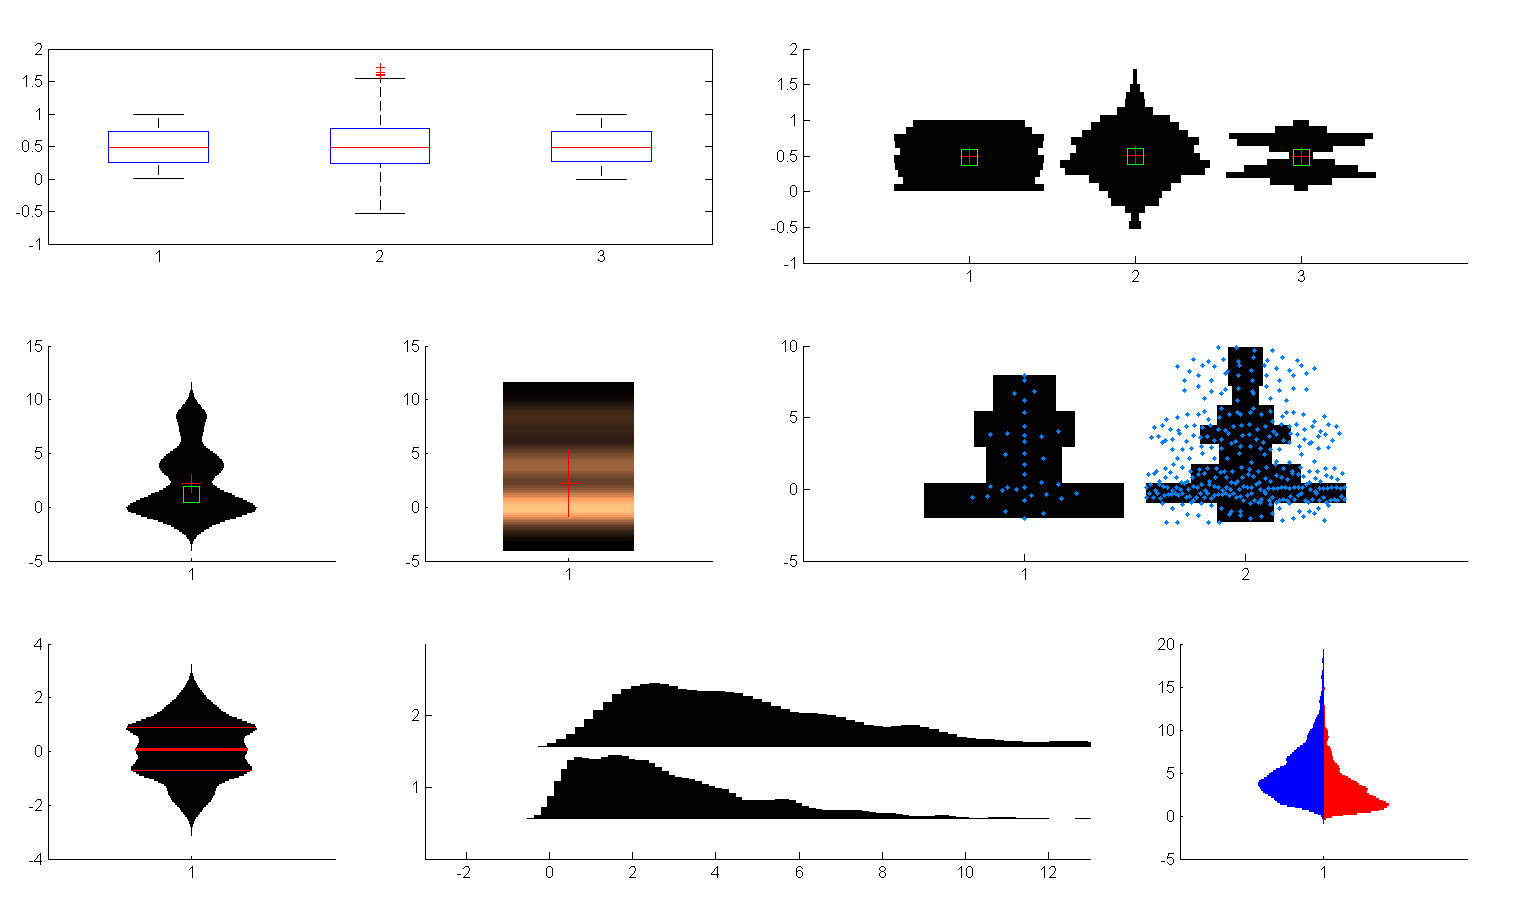
帮助中的一些示例:
r=兰特(1000,1);
rn = randn (1000 1) * 0.38 + 0.5;
rn2 = [randn (500 1) * 0.1 + 0.27; randn (500 1) * 0.1 + 0.73);
rn2=最小值(rn2,1);rn2=最大值(rn2,0);
图形
啊(1)=次要情节(2、4、1:2);
箱线图((r, rn, rn2))
啊(2)=次要情节(2、4、3:4);
distributionPlot([r,rn,rn2],'histOpt',2);%histOpt=2比默认值更适用于均匀分布
集合(啊,'ylim',[-12])
%——附加选项
数据=[randn(100,1);randn(50,1)+4;randn(25,1)+8];
次要情节(2、4、5)
分布图(数据);%默认值
次要情节(2、4、6)
distributionPlot(data,'colormap',铜,'showMM',5,'variableWidth',false) %仅通过自定义colormap显示密度,显示mean/std,
小批(2,4,7:8)
distributionPlot({data(1:5:end)、repmat(data,2,1)}、'addSpread',true、'showMM',false、'histOpt',2)%auto binwidth取决于数据点的#;对于较小的n,绘制数据很有用
引用为
乔纳斯(2021)。绘制多个分布的小提琴图(distributionPlot.m)(//www.tatmou.com/matlabcentral/fileexchange/23661-violin-plots-for-plotting-multiple-distributions-distributionplot-m),MATLAB中央文件交换。恢复.