geom2d
Editor's Note:This file was selected as MATLAB CentralPick of the Week
Geometry library to handle and visualize geometric primitives such as points, lines, circles and ellipses, polylines and polygons...
The goal is to provide a low-level library for manipulating geometrical primitives, making easier the development of more complex geometric algorithms.
The library proposes functions to:
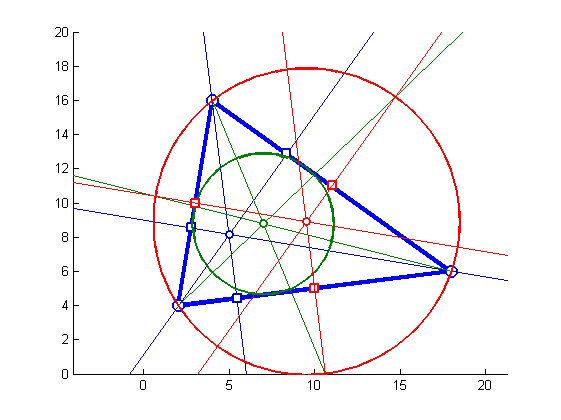
* create various shapes (points, circles, lines, ellipses, polylines, polygons) using an intuitive syntax. Ex: createCircle(p1, p2, p3) to create a circle through 3 points, create parallel and perpendicular lines
* compute intersections between 2 lines, between a line and a circle
* work on polylines and polygons: compute centroid and area, expand, clip with half-plane...
* measure distances (between points, a point and a line, a point and a group of points), angle (of a line, between 3 points), or test geometry (point on a line, on a circle).
* manipulate planar transformations. Ex: P2 = transformPoint(P1, createRotation(CENTER, THETA));
* draw shapes easily. Ex: drawCircle([50 50], 25), drawLine([X0 Y0 DX DY]). Some clipping is performed for infinite shapes such as lines or rays.
Additional help is provided in geom/Contents.m file, as well as summary files like 'points2d.m' or 'lines2d.m'.
Note: the project has merged with the geom3d library (FeX 24484), and is now hosted on GitHub:https://github.com/mattools/matGeom
Cite As
David Legland (2021).geom2d(//www.tatmou.com/matlabcentral/fileexchange/7844-geom2d), MATLAB Central File Exchange. Retrieved.
Comments and Ratings (117)
MATLAB Release Compatibility
Platform Compatibility
Windows macOS LinuxCategories
Tags
Acknowledgements
Inspired by:Minimum Enclosing Circle,Curve intersections
Inspired:Split Line Segments (Edges),Geometric and Topological Methods for Significance Testing in Wavelet Analysis,Cumulative Areawise Testing in Wavelet Analysis,Chord Length Distribution from Binary 2D Images,image ellipsoid 3D,imMinkowski,Generate random line segments without intersecting
Community Treasure Hunt
Find the treasures in MATLAB Central and discover how the community can help you!
Start Hunting!Discover Live Editor
Create scripts with code, output, and formatted text in a single executable document.
geom2d/demos-geom2d/triangle
geom2d/demos-polygons2d
geom2d/demos-polynomialCurves2d
geom2d/geom2d
geom2d/geom2d/private
geom2d/polygons2d
geom2d/polygons2d/private
geom2d/polynomialCurves2d
geom2d/utils
Select a Web Site
Choose a web site to get translated content where available and see local events and offers. Based on your location, we recommend that you select:.
Selectweb siteYou can also select a web site from the following list:
Americas
- América Latina(Español)
- Canada(English)
- United States(English)
Europe
- Belgium(English)
- Denmark(English)
- Deutschland(Deutsch)
- España(Español)
- Finland(English)
- France(Français)
- Ireland(English)
- Italia(Italiano)
- Luxembourg(English)
- Netherlands(English)
- Norway(English)
- Österreich(Deutsch)
- Portugal(English)
- Sweden(English)
- Switzerland
- United Kingdom(English)
@Jai Tsuhar: which routine do you refer to? line segment are called "edge" within the library. When using the function intersectEdgePolygon with your example, I obtain an empy matrix as output:
intersectEdgePolygon([1 0.5 0.5 0], [-1 -1; 0 -1; 0 0; -1 0])
嗨David. Thanks for this package.
However, it fails for the following case.
Suppose I have a line segment that starts (1, 0.5) and ends at (0.5, 0). Consider the polygon [-1 -1; 0 -1; 0 0; -1 0]. Then the routine will show that the line segment starting from (1,0.5) and ending at (0.5,0) is also intersecting the above polygon. I guess this happens because we do not take into account the length of the line segment. Can this be done in this code?
@Zhao chuan: I have had a look, and in fact the problem comes from the fact that first and last vertex of the polygon are the same. Removing last vertex should solve your issue. I have made a more detailed answer on GitHub.
Best,
David
嗨David, I have obtained a wrong result when I use expandPolygon, the detail description is onhttps://github.com/mattools/matGeom/issues/111, could you have a look?
嗨Hubert,
谢谢你的建议!我有固定的玩家le. New version is available on GitHub, and will be included in next version.
Best,
David
*
%Previous version
%a = abs(atan2(v(2),v(1)) - atan2(u(2),u(1)));
%New version
a = abs(mod(atan2(v(2),v(1)),2*pi) - mod(atan2(u(2),u(1)),2*pi));
嗨David,
I had some trouble with your minimumCaliperDiameter.m function with some of my cloud of points.
It appeared the problem came because of angle evaluation of your vectorAngle.m function.
I changed it a bit just by adding mod() for your atan2() results:
%Previous version
%a = abs(mod(atan2(v(2),v(1)),2*pi) - mod(atan2(u(2),u(1)),2*pi));
%New version
a = abs(mod(atan2(v(2),v(1)),2*pi) - mod(atan2(u(2),u(1)),2*pi));
I hope it will not affect the proper functionning of your other functions but for my application, it's ok.
Thank you for your work!
嗨di,
this is strange indeed... I had a look but could not reproduce... I just fixed some deprecated call in this function; if you can open an issue with a sample of code showing the pbm, that would be great!
David,
I don't quite understand.The radius on output of this function [imInscribedCircle] will be "inf" sometimes,even in the example you provided.How can it become infinite?
David,
Thank you for reply and help, which is very useful to me.Have a good day.
嗨di,
I wrote such a function. It is part of the "MatImage" toolbox (https://github.com/mattools/matImage).
Works for binary or label imags. You get get it from GitHub:https://github.com/mattools/matImage/blob/master/matImage/imMeasures/imInscribedCircle.m
David,
I have a question that does this package or other packages include an algorithm for finding the maximum inscribed circle of label image or bw image ?
Thank you very much!
David,
Thank you for a great library. I have been using both geom2d and geom3d for at least five years now.
I have just downloaded the newest versions and noticed isAxisHandle function is missing from the geom2d zip file but it is available in the respective toolbox.
Best,
BU
@joe hubbard: what do you mean? can you be more specific about the bug or problem you encounter?
Vectors do not appear to be functioning properly
嗨Kaleesh,
You can use the following code as a base example:
figure(1); clf; hold on;
drawEllipse([50 50 40 20 30]);
axis equal; axis([0 100 10 90])
This draws an ellipse centered in (50,50), with axis lengths equal to 40 and 20, and with an orientation of 30 degrees. You can obtain more info by typing "help drawEllipse".
嗨could you explain how the fuction drawEllipse(varargin) works ?
Where to enter the inputs etc?
Great stuff, does the job very well!
I have some problems making animation since all the draw* functions could not refresh data. I am able to use the method of deleting handles to achieve what I need.
Bottom line, great stuff!
Thank you very much.
@Burak: yes! It was originally developped for later versions of Matlab, and I try to keep it compatible most of matlab versions.
嗨,
Does it work with R2013b?
@mazen hakeem: the module 'graphs' is currently not packaged with the "geom2d" toolbox. You can find the related function in the parent MatGeom project, hosted in the GitHub repository:https://github.com/mattools/matGeom. The "drawGraph" function can be found athttps://github.com/mattools/matGeom/blob/master/matGeom/graphs/drawGraph.m
Best,
David
how can I find drawGraph function in geom2d?
@linken lee: I just submitted a new version that should fix the problem in clipEdge. (The problem was about checking if a point belong to an edge, but should be solved now).
@Xiadong: the vecnorm function in geom2d is obsolete for long time (since 2009 actually...), and have been replaced by the "vectorNorm" function.
Hope this helps.
Bug report: On Matlab 2017b pre-release and maybe also the coming official Matlab 2017b, the vecnorm function have name conflict with the builtin Matlab function. Could you rename them to avoid this conflict? Just to let you know that I found this problem while running 2017b pre-release. Thanks!
I report a bug.
下面函数clipEdge,我跑
edge=[ 102.5260 -1.8235 91.5926 12.6135];
box=[0 100 0 100];
clipEdge(edge, box)
the result is 101.1450 0 91.5926 12.6135
嗨Jingjing,
the polyxpoly function requires the mapping toolbox, and hence adds a dependency. The interX function works usually fine, can you describe the failing cases?
Anyway, I have updated the intersectPolylines function to avoid the call to the interX function (simply by adapting the code of interX directly into intersectPolylines).
Regards,
Thank you for the awesome package.
然而,我发现function-intersectPol中的缺陷ylines-basically you use the local function P = InterX(L1,varargin).
You can just use embedded function polyxpoly and ignore this error function.
嗨Saunhita,
I have updated a modified version that contains the missing file.
Regards,
Hello David,
First of all thank you for the awesome package. But isAxisHandle function is missing in the toolbox. Can you please upload it. TIA.
Hello Lockywolf,
It could be a problem of numerical accuracy, that can be quickly problematic with noisy data and/or result of GUI interactions.
I have tried to update the library to make it little bit more robust, in particular it is now possible to specify a 'tolerance' parameter to the polygonLoops function. This allows to tune the way vertices are detected similar, or how intersections at edges intersections are handled. Default is 1e-14, but using larger values (say 1e-12, or 1e-10) should provide better results.
Hope this helps? Otherwise feel free to open an issue on the MatGeom GitHub (ideally with running example...)
regards,
Hello, everyone. Firstly, this package is wonderful, honestly.
Secondly. There seems to be a bug in the polygonLoops code.
The code throws an exception when the polygon is very irregular with a lot of self-crossings.
I am not particularly sure how to reproduce it, but essentially, works every time I try to kind of "paint a dot" with a imfreehand, close it and and feed the result into polygonLoops.
Anyway, thanks for your work.
嗨Scrat,
you can use the "distancePointPolygon" function, using circle centers as first argument (as N-by-2 array), and square vertices as second argument (as 4-by-2 array).
regards!
Hello,
suppose i have square and three circles inside the square. ist possible to measure the shortest distance from the centroid of each circle to the square perimeter.
if so then which are the functions i can use,
Thanks
嗨Thayes,
sorry for delay... I have no answer to you problem. I would have also used the polygonSelfIntersection function, I think additional processing is required, but not that easy to implement...
嗨Stratosphere,
you can compute intersection of the polygon with rays or lines at various angles. You can use createRay for creating the rays, and intersectRayPolygon function for computing the intersections.
Hello,
Is it possible to find intersection points on the polygon with equal angles to the center point? I mean that I want to choose a point N1 on the polygon and then find the following [N1,N2,...,N36] points on the polygon such that:
Angle between N1 and Center = Theta
Angle between N2 and Center = Theta + 10
Angle between N3 and Center = Theta + 20
Angle between N4 and Center = Theta + 30
...
Angle between N36 and Center = Theta + 350
Which functions can help me? Thanks.
嗨,
I have a question on how exactly we could reorder the points of a polygon such that all the self intersections are removed ? I have tried playing around with the polygonSelfIntersection and polygonLoops function but still not figured out how to reorder the points. Thanks
嗨Filipp,
the function "projPointOnPolygon" does not rely on any toolbox, so I do not understand the difference in speed. The underlying function is "distancePointEdge", that I tried to optimize using bsxfun. Do no work with large number of vertices? Have you tried to profile to identify where code is slow? (You can contact me by mail, this will be easier to exchange)
Regards, David
嗨, I have a question on the projPointOnPolygon function. It is running extremely slow on one system with Matlab 2014b (no toolboxes installed), but works properly on another system with Matlab 2012 (most toolboxes installed). Is it using any toolboxes? Are there other reasons why it might be so slow (given that the first system even has more RAM)? Thank you!
@Tao:
In the case you propose, the test line overlap one of the edges of the polygon. The function intersectLinePolygon does not handle such degenerate cases. You can avoid it by slightly shifting the test line for example.
I probably met a bug in intersectLinePolygon.m
I call this function by:
line=[0 11.8760 1 0];
offsets= [-6.0960 11.8760;
-6.0960 11.6760;
-6.7870 11.6760;
-9.1180 11.8330;
-9.1180 11.8760;
-6.0960 11.8760];
intersect=intersectLinePolygon(line,offsets)
then I get: intersect =
-6.0960 11.8760
But it is supposed be: intersect =
-9.1180 11.8760
-6.0960 11.8760
For other situations ,it works well except this one.
Can you work it out?? My MATLAB version is : R2012a
@Jan:
I have updated a new version, with some updates on medialAxisConvex. It works on the few polygons I have tested. I hope it will fit your needs.
regards,
I tried to run demoMedialAxis and got this error:
??? Error using ==> vertcat
CAT arguments dimensions are not consistent.
Error in ==> medialAxisConvex at 123
events = [events; ir(1) i pint(1,:) ti(1); ir(2) i pint(2,:) ti(2)]; %#ok
There may be some problem with point adding. Do you know where?
Thank you
@bn dhouba:
an edge in geom2d should be understood as 'line segment'. Is defined by two extremities, and is restricted to the set of points between these two points. The functions working on 'line' objects considers infinite straigt lines. Hope this makes things clearer? regards,
嗨, i really apprciate this package it's really intresting. I just dont understand the exact meaning of edge here in the functions DrawEdge or intersecEdges , do you mean simply line? is it the same thing?
Sincerely
嗨William,
functions meshVolume and polygonArea depends on the face (or vertices) orientation. If all faces are oriented outwards, the volume will be positive. If all facets are orieted inwards, you will obtain the negative value of the volume. Just be careful to ensure faces orientation is consistent (use checkMeshAdjacentFaces for example)
I seem to get a negative volume using the meshVolume function...
I'm trying to calculate the volume of a bendy open ended cylinder, using the faces and vertices generated from an isosurface patch. Any thoughts?
嗨Jasper,
thanks for pointing out the bug! I have released a new version that should fix it. Tell me if there are still problems.
David
我相信我找到了一个错误在clipEdge函数中,however do not have the time to investigate what exactly the bug is. However, results can be different when calling clipEdge(allEdges, box) instead of clipEdge(oneEdge, box) for each box. Example variables where the error occurs can be found here:http://codepaste.net/sd1k8o
Edge in row number four is not correctly clipped when clipping all edges at once.
This is a treasure for beginners in computational geometry.
Many Thanks,
Fadi
嗨David,
thanks a lot for your suggestion. Using Delaunay triangulation sounds reasonable and I will definitely try that!
Regards,
filipp
嗨Filipp,
I think your problem is closely related to Hamiltonian path in graph theory. Maybe what you can try to do is create Delaunay triangulation of your points. This will produce a set of triangle, that you can convert to a set of edges that do not self-intersect. The set of edges form a graph, then you can find or write an algorithm that finds an Hamiltonian path that goes through each vertex once and only once. Hope this gives the idea...
By "sorting" vertices, I was meaning finding the order of indices that need to be considered. Maybe the term "ordering" would have been more appropriate. The idea is to keep the original array unchanged, and work only on vertex indices. But this is just technical consideration.
Regards,
David
嗨David,
thanks for the patience :-) The second option would be the one that I am searching for: finding a path going through a set of (random) points without self-intersecting. I already tried a brute force method: choosing a random starting point, connecting points one-by-one, and going back when intersections are found. However, this is extremely costly and did not seem to be an elegant solution. So, what do you mean by sorting vertices of interest?
Regards,
filipp
嗨Filipp,
I am not sure to really understand your question... Do you want to draw the convex hull of a set of points? Or some kind of path going through a set of points without self-intersecting? In both cases, you first need to identify and/or sort vertices of interest before plotting them.
嗨David,
thanks for your response. I've already tried these two functions, however, both allow for intersection. As a consequence, they do not result in a shape with a single circumferential contour but in a jumble of crossing lines. Do you have an alternative idea how to create closed contours from a number of random points?
Regards,
filipp
嗨filipp,
yes, you can use one of the "drawPolygon" or "fillPolygon" functions (in the "polygons" subpackage). Hope this helps ?
regards,
David
嗨David,
I search for a way to display polygons without intersecting faces (i.e., shapes with one contour). Is this function available in your package or in matgeom? If not, do you have an idea to implement this?
Thanks!
Finally, works good! Now for the real fun! Thanks, again, Ralph
Thanks, David,
Maybe I'm out of my depth here but geom looked ideal to create simulations of organic growth events as an addition to the jdk. Will it not work without Matlab?
Ralph
嗨Ralph,
There is no need to download java for using this contribution. What you get after download is a zip file that contains a set of '.m' files, in a small directory arborescence, that should be run with Matlab.
Hope this makes things clearer?
David
Ralph Trimnell
Could someone explain how to get Java to recognize geom I tried pasting the whole JAR into the jdk:no good! I put it's address in the system environment path: no good. Once extracted, it's no longer a Jar file,just has extention geom. There should be an easy way to do this. I'm using notepad on windows 8.1. Thanks
嗨,雀鳝y,
The "expansion" or "erosion" of the polygon depends on polygon orientation (counter-clockwise or clockwise) and on the sign of the distance. If polygon is CCW and distance is positive, the result will be expanded.
I have submitted a new version, that fixes some bugs. It seems to work better.
regards;
The function expandPolygon appears to have a number of problems.
The following shrinks the polygon rather then expand it:
Sq1 = [-10.28,-15.39;-17.28,-4.611;-11.89,-1.110;-4.890,-11.89]
Sq1 = [ Sq1; Sq1(1,:) ];
Sq1e = cell2mat ( expandPolygon ( Sq1, 1 ) );
And, the following generates an error within the function:
Sq = [ [-10, -5]; [-10, 5]; [-5, 5]; [ -5, -5] ];
Sq1 = (Sq * [ cos(33*pi/180) -sin(33*pi/180); sin(33*pi/180) cos(33*pi/180)]' ) * 9/7 - 3;
Sq1 = [ Sq1; Sq1(1,:) ];
Sq1e = cell2mat ( expandPolygon ( Sq1, 1 ) );
The error message is:
Attempted to access poly(0,:); index must be a
positive integer or logical.
Error in distancePointPolygon (line 19)
if sum(poly(end, :)==poly(1,:))~=2
Error in distancePolygons (line 19)
dist2 = min(distancePointPolygon(poly2, poly1));
Error in expandPolygon (line 63)
distLoop(i) = distancePolygons(loops{i}, poly);
Exactly what I was looking for. Well documented and easy to use. Thanks!
nice work.
Really nice works... Thanks
嗨sumitha,
basic format for representing lines is [x0 y0 dx dy], where (w0,y0) refers to origin point, and (dx,dy) to direction vector. You can create a line orthogonal to direction THETA with:
line1 = [x0 Y0 -sin(THETA) cos(THETA)];
drawLine(line1);
Regards.
嗨,can u please suggest me which one of these i can use to draw a line orthogonal to the given orientation(in radian)or else can u plz give me an idea how i can proceed with the same.
嗨Benjamin, the clipping of polygon is not an easy problem. There are efficient algorithms, and their inclusion is planned, but I still haven't found time to write them down. It seems the mapping toolbox provides facilities for this, maybe you can check it.
Regards, David
嗨David, thanks for the great work. I have been using your clipPolygon successfully for clipping convex polygons, but now I also need it for non-convex polygons... are you planning to include this in a future release?
Very nice and essential coding thanks for sharing.
anyone please help me
@Frank: yes, there was a stupid bug in this function. I have submitted an enhanced version that fixes it.
Regards, David
嗨, looks like a nice little toolbox!
I just tried your function "intersectLineCircle.m". Unfortunately, it seems that the code does not give the right answers for tangential lines (Returns 'nan') and lines which are not intersecting at all (gives a wrong intersection point).
Here is the data I used:
c1 = [0 0 0.5]
l1 = [0.5 0 0 1] %tangential
l1 = [-1 0 0 1] %non touching
pts = intersectLineCircle(l1, c1)
Cheers,
Frank
geom2d is a first class complement to the geometry tools provided.
David: You should add a 2D alpha shape routine. I am testing this one at the moment, but leaves lots of room for improvement.//www.tatmou.com/matlabcentral/fileexchange/6760-ashape-a-pedestrian-alpha-shape-extractor
嗨Chris,
intersection of circle with line/circle is not implemented for the moment, juste because I did not need it yet... But I will try to implement it in a future release.
Regards.
嗨, this is very useful for me? I just wonder why didn't i find the function for obtaining intersections between a line and a circle? Thanks.
Well done, David!
OK, I think this should work, circumventing eps. Again, looking at center points instead of end-points. This time the center points of segments. It still needed some fail-safe code when multiple edge segments show up inside box due to finite precission. The code should also maintain 'direction' of the edges, as your previous code.
Here the conplete code for clipEdge:
% process data input
if size(box, 1)==1
box = box([1 3 2 4]);
end
% get limits of window
xmin = box(1);
ymin = box(2);
xmax = box(3);
ymax = box(4);
% convert window limits into lines
lineX0 = [xmin ymin xmax-xmin 0];
lineX1 = [xmin ymax xmax-xmin 0];
lineY0 = [xmin ymin 0 ymax-ymin];
lineY1 = [xmax ymin 0 ymax-ymin];
edge2 = zeros(size(edge));
for i=1:size(edge,1)
% current edge
iedge = edge(i, :);
% compute intersection points with each line of bounding window
px0 = intersectLineEdge(lineX0, iedge);
px1 = intersectLineEdge(lineX1, iedge);
py0 = intersectLineEdge(lineY0, iedge);
py1 = intersectLineEdge(lineY1, iedge);
% create array of points
points = [px0; px1; py0; py1; iedge(1:2); iedge(3:4)];
% and remove infinite points (edges parallel to box edges)
points = points(all(isfinite(points),2), :);
% sort points by x then y
points = sortrows(points);
% get center positions between points
centerPoints=(points(2:end,:)+points(1:end-1,:))/2;
% find the centerPoints (if any) inside window
ins = find( centerPoints(:,1)>=xmin & centerPoints(:,2)>=ymin & ...
centerPoints(:,1)<=xmax & centerPoints(:,2)<=ymax);
% if multiple segments inside box, which can happen due to finite resolution, only take the longest segment
if length(ins)>1
dv=points(ins+1,:)-points(ins,:); % delta vectors of the segments
len=hypot(dv(:,1), dv(:,2)); % lengths of segments
[a,I]=max(len); % find index of longest segment
ins=ins(I);
end
if length(ins)==1 % if one of the center points is inside box, then the according edge segment is indide box
if edge(i,1)>edge(i,3) || (edge(i,1)==edge(i,3) && edge(i,2)>edge(i,4)) % restore same direction of edge
edge2(我:)=(点(ins + 1,:)点(ins:)];
else
edge2(i, :) = [points(ins,:) points(ins+1,:)];
end
end
end
Argh, never mind. My solution has div by 0 problem. The whole eps stuff is really a pain in the ...
turns out my suggestion above introduces a problem with negative numbers. The code below should work correctly:
% ins = find( points(:,1)-xmin>=-eps & points(:,2)-ymin>=-eps & ...
% points(:,1)-xmax<=eps & points(:,2)-ymax<=eps);
ins = find( (points(:,1)/xmin-1)*sign(xmin)>=-eps & (points(:,2)/ymin-1)*sign(ymin)>=-eps & ...
(points(:,1)/xmax-1)*sign(xmax)<=eps & (points(:,2)/ymax-1)*sign(ymax)<=eps);
Also in clipEdge() you should change the limit check. See code below. Change commented out to suggested.
cheers,
Reto
% ins = find( points(:,1)-xmin>=-eps & points(:,2)-ymin>=-eps & ...
% points(:,1)-xmax<=eps & points(:,2)-ymax<=eps);
ins = find( points(:,1)/xmin-1>=-eps & points(:,2)/ymin-1>=-eps & ...
points(:,1)/xmax-1<=eps & points(:,2)/ymax-1<=eps);
Bonjour,
again some trouble with large numbers and limit checking. This time in isPointOnEdge, which is used for intersectLineEdge, which in turn is used in clipEdges.
isPointOnEdge will not work correctly for coordinates with large numbers, as you apply a fixed tolerance. However, the numerical tolerance of matlab is relative to the number itself.
I normalized the point and edge x and y elements to the point x and y respectively. Like that you will deal with numbers in the range of 1 and your tolerance check will work.
See the code below. Note that I also dumped the Np==Ne check, as it didn't do anything.
Regards, Reto
% extract computation tolerance
tol = 1e-14;
if ~isempty(varargin)
tol = varargin{1};
end
% number of edges and of points
Np = size(point, 1);
Ne = size(edge, 1);
% adapt size of inputs
x0 = repmat(edge(:,1)', Np, 1);
y0 = repmat(edge(:,2)', Np, 1);
dx = repmat(edge(:,3)', Np, 1)-x0;
dy = repmat(edge(:,4)', Np, 1)-y0;
xp = repmat(point(:,1), 1, Ne);
yp = repmat(point(:,2), 1, Ne);
% normalize x, y to xp, yp
x0 = x0/xp;
y0 = y0/yp;
dx = dx/xp;
dy = dy/yp;
xp = 1;
yp = 1;
% test if point is located on supporting line
b1 = abs((xp-x0).*dy - (yp-y0).*dx)./hypot(dx, dy)
% check if point is located between edge bounds
% use different tests depending on line angle
ind = abs(dx)>abs(dy);
t = zeros(max(Np, Ne), 1);
t(ind) = (xp(ind)-x0(ind))./dx(ind);
t(~ind) = (yp(~ind)-y0(~ind))./dy(~ind);
b = t>-tol & t-1
嗨,
this is a good idea, much more convenient than dealing with eps. I will implement it soon.
thanks for advices !
嗨David,
你的新限制检查方向已经假定ctor of the line has a similar scale as the bounding box, which is not necessarely true. The direction vector often has a magnitude of 1, while the bounding box can be numerically very large.
Here is an idea and the thinking behind it:
You are checking the endpoints of the edge to be within the bounding box. Naturally, the end points are always on the bounding box, so you run into numerical precission issues. So why not check if the center of the edge is within the box? This way you are away from the limit lines with the exception of horizontal and vertical lines. In those two cases you should not have any numerical issues, as they are at right angles.
So, I would re-write the limit check as follows and drop eps completely:
% check if edge center is within bounds
edgeCenterX=sum(edge(i,[1,3]))/2;
xMinOk = xmin <= edgeCenterX;
xMaxOk = edgeCenterX <= xmax;
edgeCenterY=sum(edge(i,[2,4]))/2;
yMinOk = ymin <= edgeCenterY;
yMaxOk = edgeCenterY <= ymax;
It works for me.
嗨Reto,
thank you for your numerous and constructive remarks. I have published a new version that take into account your corrections. I will try to propagate modification to other drawing functions.
For limit check, I have used a different strategy, but it seems to work with large bouding boxes as well. Tell me if there are still problems.
Also consider re-writing adding the precision to the limit check as follows:
xOk = xmin*(1-eps)-min(edge(:,[1,3]), [], 2)<0 & max(edge(:,[1,3]), [], 2)-xmax*(1+eps)<0;
yOk = ymin*(1-eps)-min(edge(:,[2,4]), [], 2)<0 & max(edge(:,[2,4]), [], 2)-ymax*(1+eps)<0;
This will take into consideration the scale of the limiting box. With the original code you run into precission issues when the box has large numbers (I'm working with numbers in the 1e9 range). Like this the precision is relative rather than absolute.
Yet an other bug. This library is a good start, but definitely not ready fro prime time.
in clipLine() there is incorrect indexing. Fix is below. Consider using this fixed function in drawLine() (see bug in drawLine() above).
% check bounds of result edge in each direction
% incorrect indices, indexing a edge, not a box% yOk = ymin-min(edge(:,3:4), [], 2)
% xOk = xmin-min(edge(:,1:2), [], 2)
% this is correct indexingyOk = ymin-min(edge(:,[2,4]), [], 2)
xOk = xmin-min(edge(:,[1,3]), [], 2)
oops, now my correction of the correction replaced the original correction. You can tell I'm a novice to this system...
So, here again the complete suggested correction to drawLine().
The original code will draw horizontal lines even though they are outside the axis. It will also draw lines in the quadrant to the right and below the axis.
% sort points along the x coordinate, and draw a line between
% the two in the middle
points = sortrows([px1 ; px2 ; py1 ; py2], 1);
if isfinite(points(3,1)) % if not horizontal or vertical
points=points(2:3,:);
else % else horizontal or vertical
points=points(1:2,:);
end
if points(1,1)>=xmin && points(2,1)<=xmax &&...
points(1,2)>=ymin && points(2,2)<=ymax
h(i)=line(points(1:2, 1), points(1:2, 2));
if ~isempty(varargin)
set(h(i), varargin{:});
end
else
h(i)=-1;
end
Sorry, correction to the correction:
if points(1,1)>=xmin && points(2,1)<=xmax &&...
points(1,2)>=ymin && points(2,2)<=ymax
There is a bug in intersectEdges(). Change lines 143 and 144 from
x0(out) = NaN;
x0(out) = NaN;
to
x0(i(out)) = NaN;
y0(i(out)) = NaN;
otherwise indexing is incorrect and you get false results.
@Matthew:
I have submitted a new version, that fixes the bug in the 'centroid' function, as well as many others.
regards
Minor (but fatal) bug found in centroid.m for calculating mass-weighted centroid of 2d object.
Change line 69 of the file from:
center = mean(pts.*repmat(mass, 1, 3));
to
center = mean(pts.*repmat(mass, 1, 2));
Or it will error with a subscript assignment dimension mismatch...pts is a 2-column matrix, not a 3-column matrix.
嗨Aleksandar,
at the moment there is no additional argument for drawRect function.
To specify the figure to draw in, the best is to use figure(...) before calling drawRect, eventually using hold on to avoid clearing previous image.
To change rectangle color or width, you can use the handle returned by the function:
hr = drawRect([x0 y0 w h]);
集(人力资源,“颜色”, 'r', 'linewidth', 4);
I need help with function drawRect.
Can this function have more arguments? (Like: image on which to put rectangle,rectangle color ...)
I have this part of code
picture = double(imread('test2.jpg'));
im = drawRect(...
picture,...
round((vj(pos, 2) - 1) * sF + 1),...
round((vj(pos, 2) + velicinaLica(1) - 1) * sF + 1),...
round((vj(pos, 3) - 1) * sF + 1),...
round((vj(pos, 3) + velicinaLica(2) - 1) * sF + 1),...
[1 0 0]...
);
oops, sorry for badly corrected bug...
A new version has been submitted, with suggested corrections. There are also some new functions for polygons and polylines (see for example "help polygons2d" or "help polylines2d")
I tested some of the other functions. Quite useful indeed! Thanks.
The file intersectLinePolygon.m still contains 'pi' in place of 'intersects'. The HISTORY says it has been replaced, but it has NOT been replaced yet. I downloaded the zip file on July 22, 2009.
Also, here is a clearer (and of course equivalent way) to do the update:
intersects = [];
i = 1:长度(边缘)
p0 = intersectLines(line, createLine(edges(i,1:2), edges(i,3:4)));
if isPointOnEdge(p0, edges(i,:))
intersects = [intersects; p0];
end
end
This library and its companion, geom3d, are shining jewels - indispensable for doing non-trivial calculations on objects in 2d and 3d space.
By the way, leave all the files in the geom2d directory and add the directory to your path. Then you can type "help geom2d" or "doc geom2d" and get properly linked help text in the command window or the help window. The Contents.m file is the proper "MATLAB way" of providing documentation.
嗨,
I've submitted a new version, which fixes the bug in intersectEdges, and adds new functions for manipulating polylines (intersections, distance to point...). Please do not hesitate to report bugs (direct email preferred).
The 'pi' variable (cf. alexia's comment) was not supposed to cause problem, as it is located inside of a function. The goal of the library is mainly to hide computational details into functions with explicit names, without having to read the inner code. However, the variable 'pi' was renamed in a more appropriate (and hopefully explicit) name.
regards, David
I've tried the function intersectEdges but found that some cases are mishanlded etc.
嗨, what a bad name for a variable/function "pi", I mean:
"pi=intersectLinePolygon(line, points)"
I had a headache trying to discover what was wrong with this file (because in theory it should work), it was part of a very large project I was working in.
Finally I discovered the "pi" issue, "pi" is present in the code, but I also had to work with pi=3.1415..., and this cr*p of matlab got confused. Oh Mathematica !, I have such good memories...
Certainly is not so clever call a variable/function "pi" in a geometry script. Besides, as peter said is very badly commented (found errors), so don't trust to much with this one.
very helpful in implementing more complicated geometry algorithms
drawLabels doesn't actually draw any labels...
Tried circleaspolygon and rectaspolygon but both were not self contained, badly explained. The package seems to be promising but far from plug and play.
Very handy functions for geometric analysis