You can now acquire live lidar data from select Velodyne LiDAR sensors directly into MATLAB. This video will show you how to get started.
首先,我会审核如何连接到硬件。然后我将展示在Matlab中读取LIDAR点云的不同选项。最后,您将看到如何开始使用Matlab中的一些激光器处理功能。
在你开始之前,你要确保that you have installed all the required products and hardware support packages.
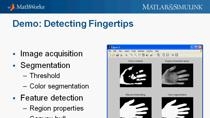
The following Velodyne LiDAR sensors are currently supported. For this example, I’ll be using a Velodyne Puck sensor.
Here is the sensor as it is mounted to my desk. I have it connected to power and to my computer’s ethernet port.
在从MATLAB连接到传感器之前,我将使用VeloView软件查看连接,这是一个免费的第三方工具。
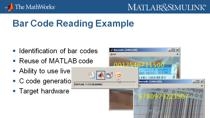
I can open the sensor steam, specify the sensor that I’m using and the lidar port. Here I’m using the default, which is 2368. And I can see the data coming from the sensor live, and if I move around my office, you can see this movement in the displayed point cloud.
所以这一切都很好。我可以从matlab连接到传感器。在我这样做之前,我应该确保关闭VeloView软件。
In MATLAB, I can connect to the sensor using the velodynelidar function. Specify the sensor name. Here you can also specify the port and the calibration file if you have one. I’m using the defaults for those. The default calibration file is the one that’s provided by Velodyne LiDAR.
所以你可以看到我已成功连接到此设备。我可以通过预览功能预览来自传感器的数据。现在,您可以看到数据将流入MATLAB图形。再一次,如果我在办公室迁移,你可以看到预览更新以反映这一点。
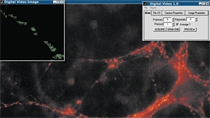
But the streaming preview does not save any data. If I want to actually acquire data in MATLAB, I can use the read function. And that will read data into a point cloud variable. So you can see I’ve read a single point cloud with 57,000 points into MATLAB. I can view this point cloud using the pcshow function. So that data has now been acquired and visualized in MATLAB.
除了按需点云读数外,我还可以将数据传送到MATLAB中的缓冲区。如果我开始获取v并查看对象,我们现在可以看到流为真,可用点云的数量继续增加。
I can read point clouds from the beginning of the buffer, either one at a time or in groups, and I can analyze this data in MATLAB while data continues to stream into the end of the buffer.
我也可以停止缓冲的收购。当我这样做时,我仍然可以访问缓冲区中的剩余数据。因此,从设备中读取点云存在一些不同的选项。
Now let’s say I’d like to start doing some processing of these point clouds. When I want to learn how to do something in MATLAB, I like to search the documentation. If I search for lidar processing, I see that there are entire documentation sections dedicated to this. Let’s say I want to do some segmentation. There is a section here with a number of lidar preprocessing functions available. I see that one of them is pcsegdist, which can segment point clouds into clusters based on Euclidean distance.
每当我第一次尝试使用新功能时,我都喜欢查看可用的示例。在这里,我在这里看到了一个示例,其中创建了一些人造球体数据,然后基于距离分段和被发现的两个簇通过颜色区分。这似乎是一个有趣的应用程序。我将在Matlab中打开实时脚本。我可以刚刚运行这一点,而不是使用这个人工数据,我将用特定于我的应用程序的数据替换它,这是来自我的传感器的实时数据。
所以现在如果我运行这个,它将从我的传感器读取,然后在该数据上执行这些计算的其余计算。
现在我可以在这个情节中看到,我办公室里的大多数积分都被发现是在同一群体中,在我办公室的椅子上有一个第二集群在我身后。
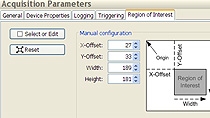
If I want to find more distinct clusters in my office, I can change this minimum distance so that rather than points needing to be half a meter away to be distinct clusters, let’s say they only need to be ten centimeters away. And I’ll also change the colormap so that adjacent clusters have more distinct colors.
现在让我们再次运行这个问题。
在弹出的图中,我可以看到我办公室中发现的不同段有许多不同的颜色。我在这里被识别为一种颜色。我的椅子是一种不同的颜色。这个墙上有我的电脑,它是另一种颜色。在我办公室的远侧,在这台书桌上发现了几个不同的集群。
So these are some of the first steps that I would take exploring some new lidar processing function and then adapting it to my own needs.
So to review, I’ve gone through three steps that are needed to get started with hardware. First testing your connection and then connecting in MATLAB with the velodyne lidar function. You can read point clouds with the read function and stream point clouds with the start and stop functions. And then when you move on to processing, you can explore provided point cloud processing functionality and adapt these examples to suit your own needs.
谢谢。