Selecting an Interpolant Fit
Selecting an Interpolant Fit Interactively
In the Curve Fitting app, selectInterpolantfrom the model type list.
TheInterpolant适合category fits an interpolating curve or surface that passes through every data point. For surfaces, the Interpolant fit type uses the MATLAB®scatteredInterpolantfunction for linear and nearest methods, the MATLABgriddatafunction for cubic and biharmonic methods, and thetpapsfunction for thin-plate spline interpolation.
The settings are shown here.
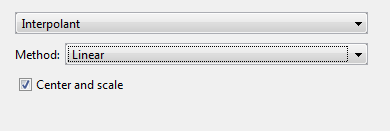
You can specify theMethodsetting:Nearest neighbor,Linear,Cubic,Shape-preserving (PCHIP)(for curves),Biharmonic (v4)(for surfaces) orThin-plate spline(for surfaces). For details, seeAbout Interpolation Methods.
Tip
If you are fitting a surface and your input variables have different scales, turn theCenter and scaleoption on and off to see the difference in the surface fit. Normalizing the inputs can strongly influence the results of the triangle-based (i.e., piecewiseLinearandCubicinterpolation) andNearest neighborsurface interpolation methods.
For surfaces, try thin-plate splines when you require both smooth surface interpolation and good extrapolation properties.
Fit Linear Interpolant Models Using the适合Function
This example shows how to use the适合function to fit linear interpolant models to data.
Interpolant Fitting Methods
Specify the interpolant model method when calling the适合function using one of the options outlined inInterpolant Model Names. None of the interpolant methods has any additional fit option parameters.
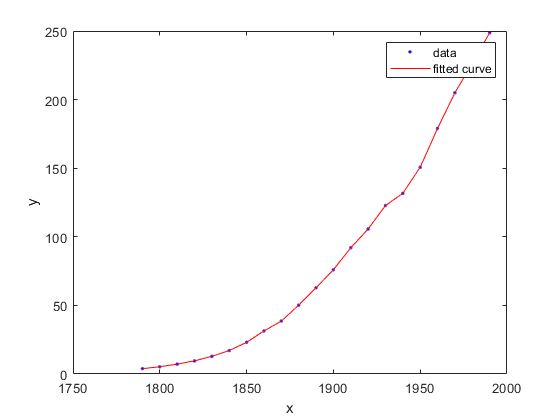
Fit a Linear Interpolant Model
Load data and fit a linear interpolant model using the'linearinterp'option.
loadcensusf = fit(cdate,pop,'linearinterp'); plot(f,cdate,pop);
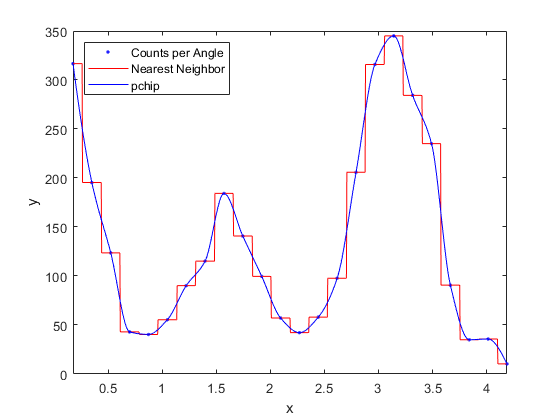
Compare Linear Interpolant Models
Load data and create both nearest neighbor and pchip interpolant fits using the'nearestinterp'and“pchip”options.
loadcarbon12alphaf1 = fit(angle,counts,'nearestinterp'); f2 = fit(angle,counts,“pchip”);
Compare the fitted curvesf1andf2on a plot.
p1 = plot(f1,angle,counts); xlim([min(angle),max(angle)]) holdonp2 = plot(f2,'b'); holdofflegend([p1;p2],'Counts per Angle','Nearest Neighbor',“pchip”,...'Location','northwest')
For an alternative to 'cubicinterp' or 'pchipinterp', you can use other spline functions that give you greater control over what you create. SeeAbout Splines in Curve Fitting Toolbox.
See Also
Related Topics
Select a Web Site
Choose a web site to get translated content where available and see local events and offers. Based on your location, we recommend that you select:.
Selectweb siteYou can also select a web site from the following list:
Americas
- América Latina(Español)
- Canada(English)
- United States(English)
Europe
- Belgium(English)
- Denmark(English)
- Deutschland(Deutsch)
- España(Español)
- Finland(English)
- France(Français)
- Ireland(English)
- Italia(Italiano)
- Luxembourg(English)
- Netherlands(English)
- Norway(English)
- Österreich(Deutsch)
- Portugal(English)
- Sweden(English)
- Switzerland
- United Kingdom(English)