Graphics
MATLAB®provides many techniques for plotting numerical data. Symbolic Math Toolbox™ expands these graphical capabilities by providing plotting functions for symbolic expressions, equations, and functions. These plots can be in 2-D or 3-D as lines, contours, surfaces, or meshes. You can create plots in Cartesian or polar coordinates. You also can create animated plots.

Functions
Properties
Topics
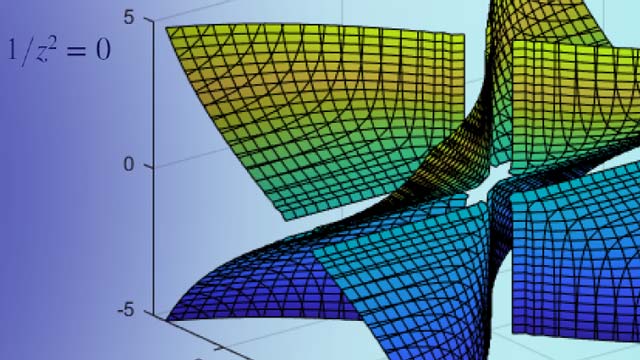
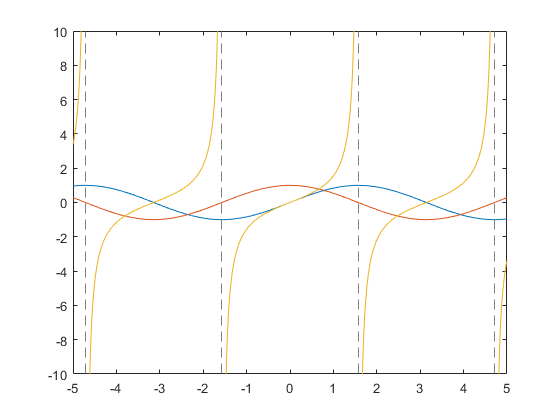
Plot symbolic expressions, including parametric or implicit expressions, in 2-D or 3-D as line, contour, or surface plots.
Plotting in Spherical Coordinate System
Plotting in spherical coordinate system.
Featured Examples
Select a Web Site
Choose a web site to get translated content where available and see local events and offers. Based on your location, we recommend that you select:.
Selectweb siteYou can also select a web site from the following list:
Americas
- América Latina(Español)
- Canada(English)
- United States(English)
Europe
- Belgium(English)
- Denmark(English)
- Deutschland(Deutsch)
- España(Español)
- Finland(English)
- France(Français)
- Ireland(English)
- Italia(Italiano)
- Luxembourg(English)
- Netherlands(English)
- Norway(English)
- Österreich(Deutsch)
- Portugal(English)
- Sweden(English)
- Switzerland
- United Kingdom(English)