nichols
Nichols chart of frequency response
Syntax
nichols(sys)
nichols(sys,w)
nichols(sys1,sys2,...,sysN)
nichols(sys1,sys2,...,sysN,w)
nichols(sys1,'PlotStyle1',...,sysN,'PlotStyleN')
[mag,phase,w] = nichols(sys)
[mag,phase] = nichols(sys,w)
Description
nicholscreates a Nichols chart of the frequency response. A Nichols chart displays the magnitude (in dB) plotted against the phase (in degrees) of the system response. Nichols charts are useful to analyze open- and closed-loop properties of SISO systems, but offer little insight into MIMO control loops. Usengridto superimpose a Nichols chart on an existing SISO Nichols chart.
nichols(sys)creates a Nichols chart of thedynamic systemsys. This model can be continuous or discrete, SISO or MIMO. In the MIMO case,nicholsproduces an array of Nichols charts, each plot showing the response of one particular I/O channel. The frequency range and gridding are determined automatically based on the system poles and zeros.
nichols(sys,w)specifies the frequency range or frequency points to be used for the chart. To focus on a particular frequency interval[wmin,wmax], setw = {wmin,wmax}. To use particular frequency points, setwto the vector of desired frequencies. Uselogspaceto generate logarithmically spaced frequency vectors. Frequencies must be inrad/TimeUnit, whereTimeUnitis the time units of the input dynamic system, specified in theTimeUnitproperty ofsys.
nichols(sys1,sys2,...,sysN)ornichols(sys1,sys2,...,sysN,w)superimposes the Nichols charts of several models on a single figure. All systems must have the same number of inputs and outputs, but may otherwise be a mix of continuous- and discrete-time systems. You can also specify a distinctive color, linestyle, and/or marker for each system plot with the syntaxnichols(sys1,'PlotStyle1',...,sysN,'PlotStyleN').
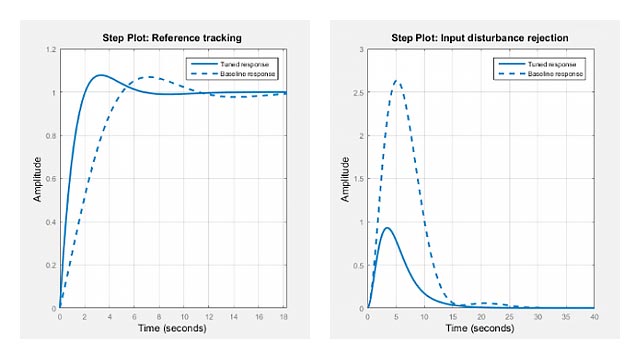
Seebodefor an example.
[mag,phase,w] = nichols(sys)or[mag,phase] = nichols(sys,w)returns the magnitude and phase (in degrees) of the frequency response at the frequenciesw(inrad/TimeUnit). The outputsmag和phaseare 3-D arrays similar to those produced bybode(see thebodereference page). They have dimensions
(number of outputs) × (number of inputs) × (length of w)
Examples
Nichols Response with Nichols Grid Lines
Plot the Nichols response with Nichols grid lines for the following system:
H = tf([-4 48 -18 250 600],[1 30 282 525 60]); nichols(H) ngrid
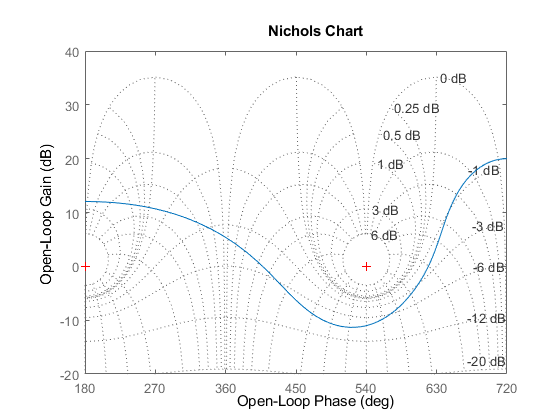
The context menu for Nichols charts includes theTightoption underZoom. You can use this option to clip unbounded branches of the Nichols chart.
Tips
You can change the properties of your plot, for example the units. For information on the ways to change properties of your plots, seeWays to Customize Plots.
Algorithms
Seebode.
Select a Web Site
Choose a web site to get translated content where available and see local events and offers. Based on your location, we recommend that you select:.
Selectweb siteYou can also select a web site from the following list:
Americas
- América Latina(Español)
- Canada(English)
- United States(English)
Europe
- Belgium(English)
- Denmark(English)
- Deutschland(Deutsch)
- España(Español)
- Finland(English)
- France(Français)
- Ireland(English)
- Italia(Italiano)
- Luxembourg(English)
- Netherlands(English)
- Norway(English)
- Österreich(Deutsch)
- Portugal(English)
- Sweden(English)
- Switzerland
- United Kingdom(English)