pointCloudPlotter
Point cloud plotter for bird's-eye plot
Description
pcPlotter= pointCloudPlotter(bep)Plottersproperty of the input bird's-eye plot object,bep. To plot the lidar point cloud data, use theplotPointCloudfunction.
pcPlotter= pointCloudPlotter(bep,Name,Value)'DisplayName','Point Cloud'sets the display name that appears in the bird's-eye-plot legend to "Point Cloud".
Examples
Generate Lidar Point Cloud Data of Multiple Actors
Generate lidar point cloud data for a driving scenario with multiple actors by using thelidarPointCloudGeneratorSystem object. Create the driving scenario by usingdrivingScenarioobject. It contains an ego-vehicle, pedestrian and two other vehicles.
创建一个nd plot a driving scenario with multiple vehicles
创建一个driving scenario.
scenario = drivingScenario;
Add a straight road to the driving scenario. The road has one lane in each direction.
roadCenters = [0 0 0; 70 0 0]; laneSpecification = lanespec([1 1]); road(scenario,roadCenters,'Lanes',laneSpecification);
Add an ego vehicle to the driving scenario.
egoVehicle = vehicle(scenario,'ClassID',1,'Mesh',driving.scenario.carMesh); waypoints = [1 -2 0; 35 -2 0]; smoothTrajectory(egoVehicle,waypoints,10);
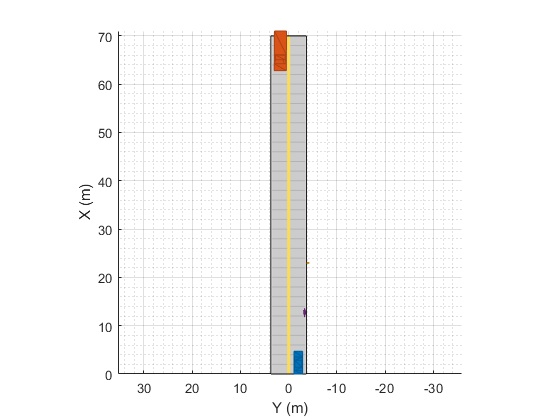
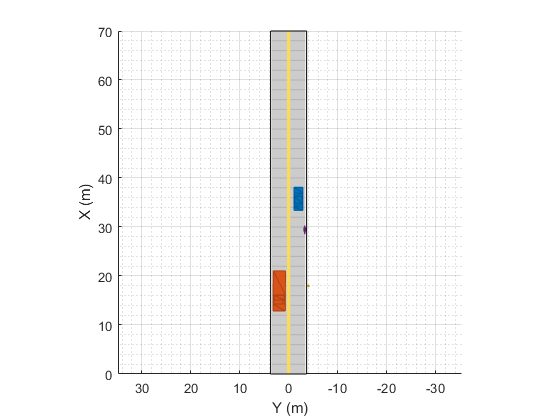
Add a truck, pedestrian, and bicycle to the driving scenario and plot the scenario.
truck = vehicle(scenario,'ClassID',2,'Length', 8.2,'Width',2.5,'Height',3.5,...'Mesh',driving.scenario.truckMesh); waypoints = [70 1.7 0; 20 1.9 0]; smoothTrajectory(truck,waypoints,15); pedestrian = actor(scenario,'ClassID',4,'Length',0.24,'Width',0.45,'Height',1.7,...'Mesh', driving.scenario.pedestrianMesh);路点= [23-4 0; 10.4 -4 0]; smoothTrajectory(pedestrian,waypoints,1.5); bicycle = actor(scenario,'ClassID',3,'Length',1.7,'Width',0.45,'Height',1.7,...'Mesh',driving.scenario.bicycleMesh); waypoints = [12.7 -3.3 0; 49.3 -3.3 0]; smoothTrajectory(bicycle,waypoints,5); plot(scenario,'Meshes','on')
Generate and plot lidar point cloud data
创建一个lidarPointCloudGeneratorSystem object.
lidar = lidarPointCloudGenerator;
Add actor profiles and the ego vehicle actor ID from the driving scenario to the System object.
lidar.ActorProfiles = actorProfiles(scenario); lidar.EgoVehicleActorID = egoVehicle.ActorID;
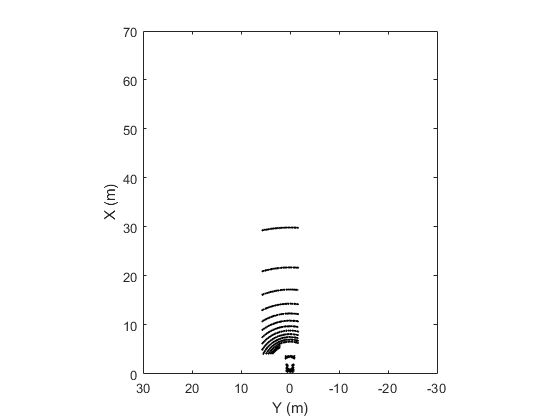
Plot the point cloud data.
bep = birdsEyePlot('Xlimits',[0 70],'YLimits',[-30 30]); plotter = pointCloudPlotter(bep); legend('off');whileadvance(scenario) tgts = targetPoses(egoVehicle); rdmesh = roadMesh(egoVehicle); [ptCloud,isValidTime] = lidar(tgts,rdmesh,scenario.SimulationTime);ifisValidTime plotPointCloud(plotter,ptCloud);endend
Input Arguments
bep—Bird’s-eye plot
birdsEyePlotobject
Bird’s-eye plot, specified as abirdsEyePlotobject.
Name-Value Arguments
Specify optional pairs of arguments asName1=Value1,...,NameN=ValueN, whereNameis the argument name andValueis the corresponding value. Name-value arguments must appear after other arguments, but the order of the pairs does not matter.
Before R2021a, use commas to separate each name and value, and encloseNamein quotes.
Example:'DisplayName','Point Cloud'sets the display name that appears in the bird's-eye-plot legend to "Point Cloud".
DisplayName—Plotter name to display in legend
''(default) |character vector|string scalar
Plotter name to display in legend, specified as the comma-separated pair consisting of'DisplayName'and character vector or string scalar. If you do not specify a name, the bird's-eye plot does not display a legend entry for the plotter.
Data Types:char|string
PointSize—Size of marker for points in point cloud
6(default) |positive integer
Size of marker for points in a point cloud, specified as the comma-separated pair consisting of'PointSize'and a positive integer in points.
Color—Point fill color
'none'(default) |RGB triplet|hexadecimal color code|color name|short color name
Point fill color, specified as the comma-separated pair consisting of'Color'and an RGB triplet, a hexadecimal color code, a color name, or a short color name.
For a custom color, specify an RGB triplet or a hexadecimal color code.
An RGB triplet is a three-element row vector whose elements specify the intensities of the red, green, and blue components of the color. The intensities must be in the range
[0,1]; for example,[0.4 0.6 0.7].A hexadecimal color code is a character vector or a string scalar that starts with a hash symbol (
#) followed by three or six hexadecimal digits, which can range from0toF. The values are not case sensitive. Thus, the color codes'#FF8800','#ff8800','#F80', and'#f80'are equivalent.
Alternatively, you can specify some common colors by name. This table lists the named color options, the equivalent RGB triplets, and hexadecimal color codes.
| Color Name | Short Name | RGB Triplet | Hexadecimal Color Code | Appearance |
|---|---|---|---|---|
“红色” |
'r' |
[1 0 0] |
'#FF0000' |
|
'green' |
'g' |
[0 1 0] |
'#00FF00' |
|
'blue' |
'b' |
[0 0 1] |
'#0000FF' |
|
'cyan' |
'c' |
[0 1 1] |
'#00FFFF' |
|
'magenta' |
'm' |
[1 0 1] |
'#FF00FF' |
|
'yellow' |
'y' |
[1 1 0] |
'#FFFF00' |
|
'black' |
'k' |
[0 0 0] |
'#000000' |
|
'white' |
'w' |
[1 1 1] |
'#FFFFFF' |
|
'none' |
Not applicable | Not applicable | Not applicable | No color |
Here are the RGB triplets and hexadecimal color codes for the default colors MATLAB®uses in many types of plots.
| RGB Triplet | Hexadecimal Color Code | Appearance |
|---|---|---|
[0 0.4470 0.7410] |
'#0072BD' |
|
[0.8500 0.3250 0.0980] |
'#D95319' |
|
[0.9290 0.6940 0.1250] |
'#EDB120' |
|
[0.4940 0.1840 0.5560] |
'#7E2F8E' |
|
[0.4660 0.6740 0.1880] |
'#77AC30' |
|
[0.3010 0.7450 0.9330] |
'#4DBEEE' |
|
[0.6350 0.0780 0.1840] |
'#A2142F' |
|
Tag—Tag associated with plotter object
'PlotterN'(default) |character vector|string scalar
N'Tag associated with the plotter object, specified as the comma-separated pair consisting of'Tag'and a character vector or string scalar. The default value is'Plotter, whereN'Nis an integer that corresponds to theNth plotter associated with the inputbirdsEyePlotobject.
Output Arguments
Version History
You can also select a web site from the following list:
Americas
- América Latina(Español)
- Canada(English)
- United States(English)
Europe
- Belgium(English)
- Denmark(English)
- Deutschland(Deutsch)
- España(Español)
- Finland(English)
- France(Français)
- Ireland(English)
- Italia(Italiano)
- Luxembourg(English)
- Netherlands(English)
- Norway(English)
- Österreich(Deutsch)
- Portugal(English)
- Sweden(English)
- Switzerland
- United Kingdom(English)