Correct Nonuniform Illumination and Analyze Foreground Objects
This example shows how to enhance an image as a preprocessing step before analysis. In this example, you correct the nonuniform background illumination and convert the image into a binary image to make it easy to identify foreground objects (individual grains of rice). You can then analyze the objects, such as finding the area of each grain of rice, and you can compute statistics for all objects in the image.
Preprocess the Image
Read an image into the workspace.
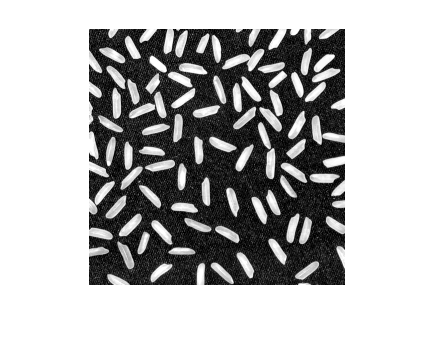
I = imread('rice.png'); imshow(I)

The background illumination is brighter in the center of the image than at the bottom. Preprocess the image to make the background illumination more uniform.
As a first step, remove all the foreground (rice grains) using morphological opening. The opening operation removes small objects that cannot completely contain the structuring element. Define a disk-shaped structuring element with a radius of 15, which does fit entirely inside a single grain of rice.
se = strel('disk',15)
se = strel is a disk shaped structuring element with properties: Neighborhood: [29x29 logical] Dimensionality: 2
To perform the morphological opening, useimopenwith the structuring element.
background = imopen(I,se); imshow(background)

Subtract the background approximation image,background, from the original image,I, and view the resulting image. After subtracting the adjusted background image from the original image, the resulting image has a uniform background but is now a bit dark for analysis.
I2 = I - background; imshow(I2)

Useimadjustto increase the contrast of the processed imageI2by saturating 1% of the data at both low and high intensities and by stretching the intensity values to fill theuint8dynamic range.
I3 = imadjust(I2); imshow(I3)
注意前两个步骤可以取而代之a single step usingimtophatwhich first calculates the morphological opening and then subtracts it from the original image.
I2 = imtophat(I,strel('disk',15));
Create a binary version of the processed image so you can use toolbox functions for analysis. Use theimbinarizefunction to convert the grayscale image into a binary image. Remove background noise from the image with thebwareaopenfunction.
bw = imbinarize(I3); bw = bwareaopen(bw,50); imshow(bw)

Identify Objects in the Image
Now that you have created a binary version of the original image you can perform analysis of objects in the image.
Find all the connected components (objects) in the binary image. The accuracy of your results depends on the size of the objects, the connectivity parameter (4, 8, or arbitrary), and whether or not any objects are touching (in which case they could be labeled as one object). Some of the rice grains in the binary imagebware touching.
cc = bwconncomp(bw,4)
cc =struct with fields:Connectivity: 4 ImageSize: [256 256] NumObjects: 95 PixelIdxList: {1x95 cell}
cc.NumObjects
ans = 95
View the rice grain that is labeled 50 in the image.
grain = false(size(bw)); grain(cc.PixelIdxList{50}) = true; imshow(grain)

Visualize all the connected components in the image by creating a label matrix and then displaying it as a pseudocolor indexed image.
Uselabelmatrixto create a label matrix from the output ofbwconncomp. Note thatlabelmatrixstores the label matrix in the smallest numeric class necessary for the number of objects.
labeled = labelmatrix(cc); whoslabeled
Name Size Bytes Class Attributes labeled 256x256 65536 uint8
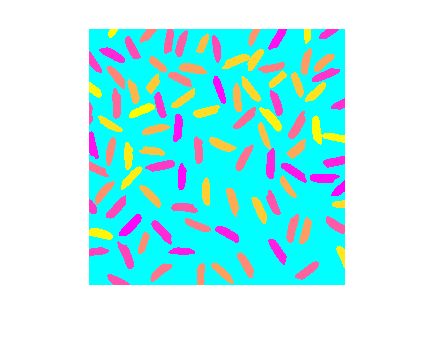
Uselabel2rgbto choose the colormap, the background color, and how objects in the label matrix map to colors in the colormap. In the pseudocolor image, the label identifying each object in the label matrix maps to a different color in an associated colormap matrix.
RGB_label = label2rgb(labeled,'spring','c','shuffle'); imshow(RGB_label)
Compute Area-Based Statistics
Compute the area of each object in the image usingregionprops. Each rice grain is one connected component in theccstructure.
graindata = regionprops(cc,'basic')
graindata=95×1 struct array with fields:Area Centroid BoundingBox
Create a new vectorgrain_areas, which holds the area measurement for each grain.
grain_areas = [graindata.Area];
Find the area of the 50th component.
grain_areas(50)
ans = 194
Find and display the grain with the smallest area.
[min_area, idx] = min(grain_areas)
min_area = 61
idx = 16
grain = false(size(bw)); grain(cc.PixelIdxList{idx}) = true; imshow(grain)

Use thehistogramcommand to create a histogram of rice grain areas.
histogram(grain_areas) title('Histogram of Rice Grain Area')

See Also
bwareaopen|bwconncomp|imadjust|imbinarize|imopen|imread|imshow|label2rgb|labelmatrix|regionprops
Select a Web Site
Choose a web site to get translated content where available and see local events and offers. Based on your location, we recommend that you select:.
Selectweb siteYou can also select a web site from the following list:
Americas
- América Latina(Español)
- Canada(English)
- United States(English)
Europe
- Belgium(English)
- Denmark(English)
- Deutschland(Deutsch)
- España(Español)
- Finland(English)
- France(Français)
- Ireland(English)
- Italia(Italiano)
- Luxembourg(English)
- Netherlands(English)
- Norway(English)
- Österreich(Deutsch)
- Portugal(English)
- Sweden(English)
- Switzerland
- United Kingdom(English)