textscatter
2-D scatter plot of text
Syntax
Description
ts= textscatter(___,Name,Value)TextScatterproperties using one or more name-value pair arguments.
Examples
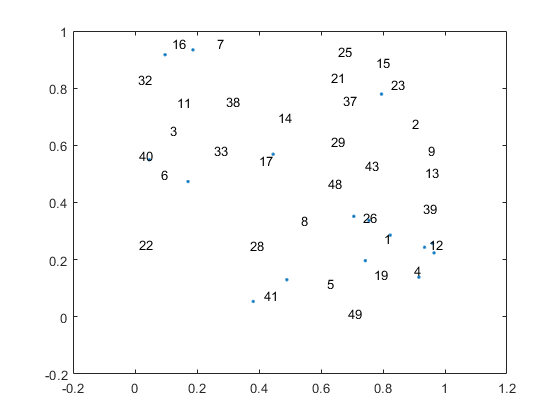
Create Text Scatter Plot
Plot a string array of numbers at random points on a text scatter plot.
x = rand(50,1); y = rand(50,1); str = string(1:50); figure textscatter(x,y,str);

Alternatively, you can pass the coordinatesxandyas a matrixxy, wherexandyare the columns ofxy.
xy = [x y]; figure textscatter(xy,str)
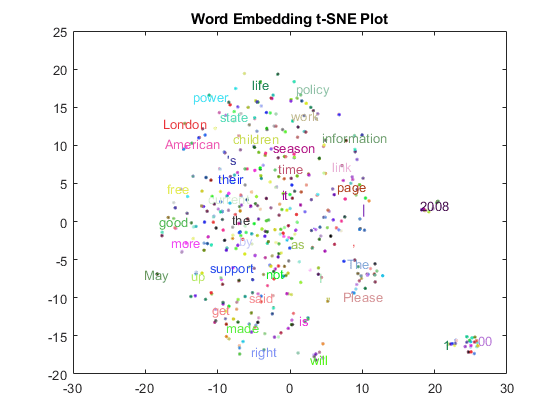
Specify Word Colors
Create text scatter plot of a word embedding and specify word colors.
Load a pretrained word embedding usingfastTextWordEmbedding. This function requires Text Analytics Toolbox™ Modelfor fastText English 16 Billion Token Word Embeddingsupport package. If this support package is not installed, then the function provides a download link.
emb = fastTextWordEmbedding
emb = wordEmbedding with properties: Dimension: 300 Vocabulary: [1×1000000 string]
Convert the first 500 words to vectors usingword2vec.Vis a matrix of word vectors of length 300.
words = emb.Vocabulary(1:500); V = word2vec(emb,words); size(V)
ans =1×2500 300
Embed the word vectors in two-dimensional space usingtsne.
XY = tsne(V);
Plot the words at the coordinates specified byXYin a 2-D text scatter plot. Specify the word colors to be random.
numWords = numel(words); colorData = rand(numWords,3); figure textscatter(XY,words,'ColorData',colorData) title("Word Embedding t-SNE Plot")
Input Arguments
Output Arguments
Select a Web Site
Choose a web site to get translated content where available and see local events and offers. Based on your location, we recommend that you select:.
Selectweb siteYou can also select a web site from the following list:
Americas
- América Latina(Español)
- Canada(English)
- United States(English)
Europe
- Belgium(English)
- Denmark(English)
- Deutschland(Deutsch)
- España(Español)
- Finland(English)
- France(Français)
- Ireland(English)
- Italia(Italiano)
- Luxembourg(English)
- Netherlands(English)
- Norway(English)
- Österreich(Deutsch)
- Portugal(English)
- Sweden(English)
- Switzerland
- United Kingdom(English)