Choose Training Configurations for Sequence-to-Sequence Regression
此示例显示了如何创建深度学习实验,以比较序列到序列回归的不同数据预处理和网络深度配置。在此示例中,您使用实验经理to train long short-term memory (LSTM) networks that predict the remaining useful life (RUL) of engines. The experiment uses the Turbofan Engine Degradation Simulation Data Set described in [1]. For more information on processing this data set for sequence-to-sequence regression, seeSequence-to-Sequence Regression Using Deep Learning。
RUL captures how many operational cycles an engine can make before failure. To learn more from the sequence data when the engines are close to failing, preprocess the data by clipping the responses at a specified threshold. This preprocessing operation allows the network to focus on predictor data behaviors close to failing by treating instances with higher RUL values as equal. For example, this figure shows the first response observation and the corresponding clipped response with a threshold of 150.

When you train a deep learning network, how you preprocess data and the number of layers in the network can affect the training behavior and performance of the network. Choosing the depth of an LSTM network involves balancing speed and accuracy. For example, deeper networks can be more accurate but take longer to train and converge [2].
By default, when you run a built-in training experiment for regression, Experiment Manager computes the loss and root mean squared error (RMSE) for each trial in your experiment. This example compares the performance of the network in each trial by using a custom metric that is specific to the problem data set. For more information on using custom metric functions, seeEvaluate Deep Learning Experiments by Using Metric Functions。
开放实验
首先,打开示例。实验经理loads a project with a preconfigured experiment. To open the experiment, in theExperiment Browser, double-click the name of the experiment (SequenceRegressionExperiment).

Built-in training experiments consist of a description, a table of hyperparameters, a setup function, and a collection of metric functions to evaluate the results of the experiment. For more information, see配置内置训练实验。
这Descriptionfield contains a textual description of the experiment. For this example, the description is:
序列到序列回归,以预测发动机的剩余使用寿命(RUL)。该实验在更改数据阈值水平和LSTM层深度时比较网络性能。
这Hyperparameter Tablespecifies the strategy (Exhaustive Sweep) and hyperparameter values to use for the experiment. When you run the experiment, Experiment Manager sweeps through the hyperparameter values and trains the network multiple times. Each trial uses a different combination of the hyperparameter values specified in the hyperparameter table. This example uses two hyperparameters:
'Threshold'sets all response data above the threshold value to be equal to the threshold value. To prevent uniform response data, use threshold values greater or equal to 150.'LSTMDepth'指示网络中使用的LSTM层数。将此超参数指定为1和3之间的整数。
这Setup Functionconfigures the training data, network architecture, and training options for the experiment. To inspect the setup function, underSetup Function, clickEdit。设置功能在MATLAB编辑器中打开。
In this example, the setup function has three sections.
负载和预处理数据从中下载并从中提取Turbofan Engine降解仿真数据集https://ti.arc.nasa.gov/tech/dash/groups/pcoe/prognostic-data-repository/[3]. This section of the setup function also filters out constant valued features, normalizes the predictor data to have zero mean and unit variance, clips the response data by using the value of the 'Threshold' hyperparameter, and randomly selects training examples to be used for validation.
Define Network Architecture为序列到序列回归定义LSTM网络的体系结构。该网络由具有128个隐藏单元的LSTM层组成,然后是大小100的完全连接的层和一个辍学层的掉落层,概率为0.5。LSTM层的数量等于
'LSTMDepth'value from the hyperparameter table.Specify Training Optionsdefines the training options for the experiment. Because deeper networks take longer to converge, the number of epochs is set to 300 to ensure all network depths to converge. This example validates the network every 30 iterations. The initial learning rate is 0.01 and drops by a factor of 0.2 every 15 epochs. With the training option
'ExecutionEnvironment'set to'auto', the experiment runs on a GPU if one is available. Otherwise, the software uses the CPU. Because this example compares network depths and trains for many epochs, using the GPU speeds up training time considerably. Using a GPU requires Parallel Computing Toolbox™ and a supported GPU device. For more information, seeGPU Support by Release(Parallel Computing Toolbox)。
这Metricssection specifies optional functions that evaluate the results of the experiment. Experiment Manager evaluates these functions each time it finishes training the network. To inspect a metric function, select the name of the metric function and clickEdit。MATLAB编辑器打开公制函数。
预测发动机的原则要求reful consideration. If the prediction underestimates the RUL, engine maintenance might be scheduled before it is necessary. If the prediction overestimates the RUL, the engine might fail while in operation, resulting in high costs or safety concerns. To help mitigate these scenarios, this example includes a metric functionMeanmaxabsoluteErrorthat identifies networks that underpredict or overpredict the RUL.
这MeanmaxabsoluteErrormetric calculates the maximum absolute error, averaged across the entire training set. This metric calls the预测从训练集中做出一系列RUL预测的功能。然后,在计算每个训练响应和预测响应序列之间的最大绝对误差之后,该函数计算所有最大绝对误差的平均值。该度量标识了实际响应和预测响应之间的最大偏差。
Run Experiment
When you run the experiment, Experiment Manager trains the network defined by the setup function nine times. Each trial uses a different combination of hyperparameter values. By default, Experiment Manager runs one trial at a time. If you have Parallel Computing Toolbox™, you can run multiple trials at the same time. For best results, before you run your experiment, start a parallel pool with as many workers as GPUs. For more information, see使用实验经理并行培训网络和GPU Support by Release(Parallel Computing Toolbox)。
要一次进行实验的一个试验,在实验管理器工具条上,请单击Run。
To run multiple trials at the same time, clickUse Parallel和thenRun。If there is no current parallel pool, Experiment Manager starts one using the default cluster profile. Experiment Manager then executes multiple simultaneous trials, depending on the number of parallel workers available.
A table of results displays the metric function values for each trial.

实验运行时,请单击Training Plotto display the training plot and track the progress of each trial. The elapsed time for a trial to complete training increases with network depth.

Evaluate Results
在里面table of results, theMeanmaxabsoluteError价值量化了网络预测的程度或过度预测RUL的程度。这Validation RMSEvalue quantifies how well the network generalizes to unseen data. To find the best result for your experiment, sort the table of results and select the trial that has the lowestMeanmaxabsoluteError和Validation RMSEvalues.
Point to theValidation RMSE或者MeanmaxabsoluteErrorcolumn.
Click the triangle icon.
SelectSort in Ascending Order。

If no single trial minimizes both values, consider giving preference to a trial that ranks well for each value. For instance, in these results, trial 3 has the smallestValidation RMSE价值和第二小MeanmaxabsoluteErrorvalue.
To record observations about the results of your experiment, add an annotation.
在里面results table, right-click theValidation RMSEcell of the best trial.
SelectAdd Annotation。
在里面Annotationspane, enter your observations in the text box.
Repeat the previous steps for theMeanmaxabsoluteErrorcell.

要测试最佳试验的性能,请导出受过训练的网络并显示几个随机选择的测试序列的预测响应序列。
在您的实验中选择最佳试验。
On the实验经理toolstrip, clickExport。
在里面dialog window, enter the name of a workspace variable for the exported network. The default name is
trainedNetwork。Use the exported network and the
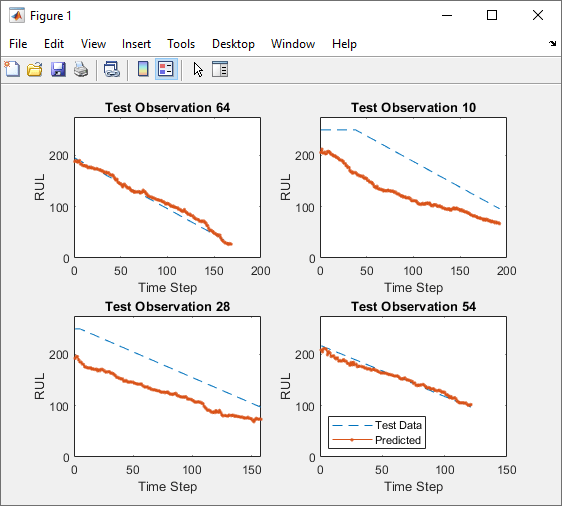
Thresholdvalue of the network as inputs to the helper functionhelperPlot。例如,在MATLAB命令窗口中,Enter:
helperPlot(trainedNetwork,150)
这function plots the true and predicted response sequences of unseen test data.
Close Experiment
在里面Experiment Browser, right-click the name of the project and select关闭项目。实验经理closes all of the experiments and results contained in the project.
参考
Saxena,Abhinav,Kai Goebel,Don Simon和Neil Eklund。“飞机发动机运行模拟的损坏传播建模。”2008年国际预后和健康管理会议(2008): 1-9.
Jozefowicz, Rafal, Wojciech Zaremba, and Ilya Sutskever. "An Empirical Exploration of Recurrent Network Architectures."Proceedings of the 32nd International Conference on Machine Learning(2015): 2342-2350.
萨克斯纳(Saxena),阿比纳夫(Abhinav),凯·戈贝尔(Kai Goebel)。“ Turbofan发动机退化模拟数据集。”NASA Ames Prognostics Data Repository,https://ti.arc.nasa.gov/tech/dash/groups/pcoe/prognostic-data-repository/, NASA Ames Research Center, Moffett Field, CA.
See Also
Apps
Functions
相关话题
Select a Web Site
Choose a web site to get translated content where available and see local events and offers. Based on your location, we recommend that you select:。
Selectweb site您还可以从以下列表中选择一个网站:
Americas
- AméricaLatina(Español)
- Canada(English)
- United States(English)
欧洲
- Belgium(English)
- 丹麦(English)
- Deutschland(德意志)
- España(Español)
- Finland(English)
- 法国(Français)
- 爱尔兰(English)
- Italia(Italiano)
- Luxembourg(English)
- Netherlands(English)
- 挪威(English)
- Österreich(德意志)
- Portugal(English)
- Sweden(English)
- Switzerland
- United Kingdom(English)