Capture Temperature Sensor Data from Xilinx FPGA Board Using FPGA Data Capture
This example shows how to use FPGA data capture with existing HDL design to capture FPGA internal signals over a JTAG or Ethernet connection. Start with an existing FPGA design that implements Xilinx® XADC IP to read the on-chip temperature sensor data. The XADC IP exposes a dynamic reconfiguration port (DRP) interface for read and write internal registers. This FPGA design contains logic that reads out the temperature sensor register from the XADC IP. To obtain the temperature reading for further analysis, use the FPGA data capture feature to read the raw sensor data into the MATLAB® workspace. Then, MATLAB converts the raw temperature data to Celsius.

Requirements and Prerequisites
MATLAB
HDL Verifier™
HDL Verifier Support Package for Xilinx FPGA Boards
Fixed-Point Designer™
Xilinx Vivado® Design Suite, with a supported version listed inSupported EDA Tools and Hardware
For JTAG connection: ZedBoard™ or Xilinx Virtex®-7 VC707 development board
For Ethernet connection: Xilinx Virtex-7 KC705 development board
JTAG cable and/or Ethernet cable
Prepare Example Resources
Set up the Xilinx Vivado Design Suite. This example assumes that the Xilinx Vivado executable is located in the fileC:\Xilinx\Vivado\2020.2\bin\vivado.bat.如果你的可执行文件的位置是不同的,use your path instead.
hdlsetuptoolpath('ToolName','Xilinx Vivado','ToolPath',...'C:\Xilinx\Vivado\2020.2\bin\vivado.bat');
Set Up FPGA Development Board
1. Confirm that the power switch is off.
2. Connect the AC power cord to the power plug and plug the power supply adapter cable into the FPGA development board.
3. Use the JTAG download cable to connect the FPGA development board with the host computer.
4. Connect the Ethernet connector on the FPGA development board directly to the Ethernet adapter on your host machine using the crossover Ethernet cable.
5. Turn on the power switch on the FPGA board.
Generate FPGA Data Capture Components
Launch theFPGA Data Capture Component Generatortool by executing this command in MATLAB.
generateFPGADataCaptureIP
This example monitors two signals from the existing HDL code for the temperature sensor system: 16 bittemperatureand 8 bitcounter.Thetemperaturesignal is the reading of register 0x00 from the XADC, which stores the converted raw temperature sensor. It has 16 bits, but only the 12-bit most significant bits (MSBs) are the raw temperature sensor reading. The last signalcounteris an 8 bit free-running counter. To configure the data capture components to operate on these two signals over a JTAG or Ethernet connection, follow these steps.
1. Add one row to thePortstable by clicking theAddbutton once.
2. Name the first signal totemperatureand the second signal tocounter.
3. Change the bit widths of the two signals to 16 and 8, respectively.
4. SelectFPGA vendorasXilinx.
5. SelectGenerated IP languageasVerilog.
6. SelectSample depthas1024.This is the number of samples of each signal that the data capture tool returns to MATLAB each time a trigger is detected.
7. SelectMax trigger stagesas2.This value is the maximum number of trigger stages that you can add during data capture to provide multiple trigger conditions.
8. SelectConnection typeas one of these options.
JTAG- To capture data over a JTAG connection
Ethernet- To capture data over an Ethernet connection

9. Ethernet connection only: SetIP addressto192.168.0.2andPort addressto50101.SelectInterface typeasGMII.This is the type of Ethernet interface of your target FPGA development board.
This figure shows these tool settings.

To generate the FPGA data capture component, clickGenerate.A report shows the results of the generation.
Integrate FPGA Data Capture HDL IP
You must include the generated HDL IP core into the example FPGA design. You can copy the module instance code from the generated report. In this example, we connect the generated HDL IP with the temperature sensor output from XADC IP and an 8-bit free-running counter.
For JTAG Connection
If you are using ZedBoard, open thetop.vfile provided with this example. If you are using VC707, open thetop_vc707.vfile provided with this example. Uncomment this code.
datacaptureu0(.clk(clk), .clk_enable(1'b1), .ready_to_capture(), .temperature(do_out), .counter(counter[7:0]));
Save the file you modified, compile the modified FPGA design, and create an FPGA programming file.
If you are using ZedBoard, execute this command in MATLAB.
system('vivado -mode batch -source data_capture_xadc_zedboard.tcl &')
If you are using VC707, execute this command in MATLAB.
system('vivado -mode batch -source data_capture_xadc_vc707.tcl &')
The above mentioned Tcl scripts that are included in this example perform these steps.
1. Create a new Vivado project.
2. Add example HDL files and the generated FPGA data capture HDL files to the project.
3. Compile the design.
4. Program the FPGA.
Wait until the Vivado process successfully finishes before going to the next step. This process takes approximately 5 to 10 minutes.
For Ethernet Connection
1. Create a Vivado project for KC705 board by executing this command in MATLAB. This command takes about one minute to run. When the execution completes, a Vivado project nameddata_capture_xadc_kc705.xprappears in your current directory.
system('vivado -mode batch -source create_project_kc705.tcl &')
2. Open the generated Vivado project in GUI mode by double-clicking the project in a file browser or executing this command in MATLAB.
system('vivado data_capture_xadc_kc705.xpr &')
3. Navigate to thehdlsrcfolder by executing this command in the Vivado Tcl console.
cd./hdlsrc
4. Insert the Ethernet MAC Hub IP and FPGA data capture IP into Vivado project by executing this command in the Vivado Tcl console. TheFPGA Data Capture Component Generatortool generates theinsertEthernet.tclscript.
source./insertEthernet.tcl
5. Complete the design by connecting IPs in the Vivado project, compile the design, and program the FPGA by executing this command in the Vivado Tcl console.
source../ethernet_data_capture_xadc_kc705.tcl
6. This figure shows the block diagram in Vivado.

Wait until the Vivado process successfully finishes before going to the next step. This process takes approximately 5 to 10 minutes.
捕获数据
Navigate to the directory where the FPGA data capture component is generated in MATLAB.
cdhdlsrc
Launch theFPGA Data Capturetool. This tool is customized for your data capture signals.
launchDataCaptureApp
To start data capture click捕获数据.This action requests one buffer of captured data from the FPGA. The default trigger setting is to capture immediately, without waiting for a trigger condition.

The captured data is saved into a structure,dataCaptureOut, in the MATLAB workspace. If you have the DSP System Toolbox™ software, the captured data is also displayed as signal waveforms in theLogic Analyzertool.
The captured temperature sensor data is in raw format. The sensor data sheet gives the formula for converting raw format data to Celsius units. Calculate and report the average temperature over all of the samples returned.
CelsiusTemp = (double(dataCaptureOut.temperature))/(2^4)*503.975/4096 - 273.15; sprintf('The FPGA Temperature is %fC\n',mean(CelsiusTemp))
狭窄的范围使用触发数据捕获
To capture data from the FPGA around a particular event, you can configure trigger conditions in theFPGA Data Captureapp. For example, capture the temperature data only after a counter reaches a certain value.
SelectNumber of trigger stagesas1.在theTrigger Stage 1section, selectSignalascounter.Enable this trigger signal by clicking the+button. Select the corresponding trigger condition value (Value) to10.The trigger mode automatically changes toOn trigger.This change tells the FPGA to wait for the trigger condition before capturing and returning data. This figure shows these tool settings.

Click捕获数据again. This time, the data capture IP returns 1024 samples, captured when it detects that the counter equals 10.
To capture data from the FPGA for specific bits in the trigger value, irrespective of other bits, you can configure the trigger condition with a bit-masked value.
For example, to capture the temperature data only when the seventh bit of the counter is 1, set the trigger condition value (Value) to0bX1XXXXXXas this figure shows.

Click捕获数据again. The data capture IP triggers to capture the temperature data for counter values in the range [64, 127] and [192, 255].
Capture Multiple Occurrences of Event
To capture a recurring event from the FPGA, configureNumber of capture windowsin theFPGA Data Capturetool.
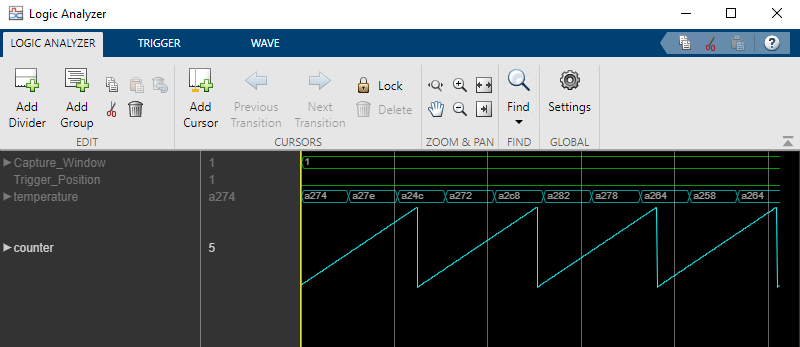
For example, to capture the temperature data at eight different time slots, selectNumber of capture windowsas8.This figure shows the updated tool settings.

Click捕获数据.The data capture IP returns eight windows of 128 samples each, which amounts to a total sample depth of 1024.
Window部th=Sample部th/Numberofcapturewindows;
TheLogic Analyzertool shows this result as eight occurrences of the trigger, with the temperature logged for 128 samples each.

The signalsCapture WindowandTrigger Positionindicate the corresponding window number and trigger position, respectively.
捕获数据in Multiple Trigger Stages
This scenario explains how to capture data by providing a sequence of trigger conditions in multiple trigger stages. For this action, you must selectNumber of trigger stagesas a value greater than 1 in theFPGA Data Capturetool.
For example, to capture an temperature data when the counter value reaches from 0 to 5 in 5 clock cycles:
1. SelectNumber of trigger stagesas2.
2. In theTrigger Stage 1section, selectSignalascounter.Enable this trigger signal by clicking the+button. Select the corresponding trigger condition value (Value) as 0.
3. InTrigger Stage 2section, selectSignalascounter.Enable this trigger signal by clicking the+button. Select the corresponding trigger condition value (Value) as5.SelectTrigger time outand set it to5.
This figure shows the updated tool settings.

Click捕获数据.The data capture IP captures 1024 samples when it detects the trigger condition in trigger stage 2 within 5 clock cycles, preceded by the trigger condition detected in trigger stage 1.
See Also
FPGA Data Capture Component Generator|FPGA Data Capture
Related Topics
You can also select a web site from the following list:
Americas
- América Latina(Español)
- Canada(English)
- United States(English)
Europe
- Belgium(English)
- Denmark(English)
- Deutschland(Deutsch)
- España(Español)
- Finland(English)
- France(Français)
- Ireland(English)
- 意大利(Italiano)
- Luxembourg(English)
- Netherlands(English)
- Norway(English)
- Österreich(Deutsch)
- Portugal(English)
- Sweden(English)
- 瑞士
- 联合王国(English)