Extract Regions of Interest from Whale Song
Load a file that contains audio data from a Pacific blue whale, sampled at 4 kHz. The file is from the library of animal vocalizations maintained by the Cornell University Bioacoustics Research Program. The time scale in the data is compressed by a factor of 10 to raise the pitch and make the calls more audible. Convert the signal to a MATLAB® timetable.
whaleFile = fullfile(matlabroot,'例子','matlab','数据','bluewhale.au'); [w,fs] = audioread(whaleFile); whale = timetable(seconds((0:length(w)-1)'/fs),w);% To hear, type soundsc(w,fs)
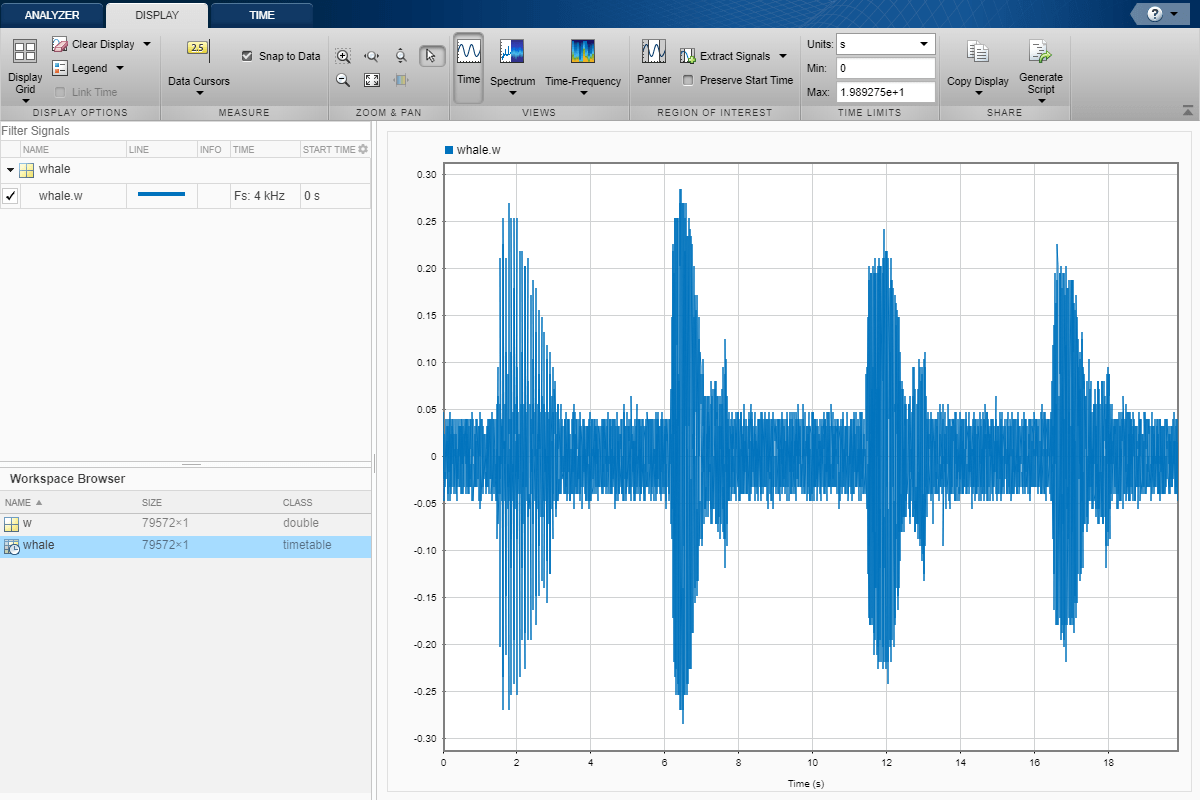
OpenSignal Analyzerand drag the timetable to a display. Four features stand out from the noise. The first is known as atrill, and the other three are known asmoans。
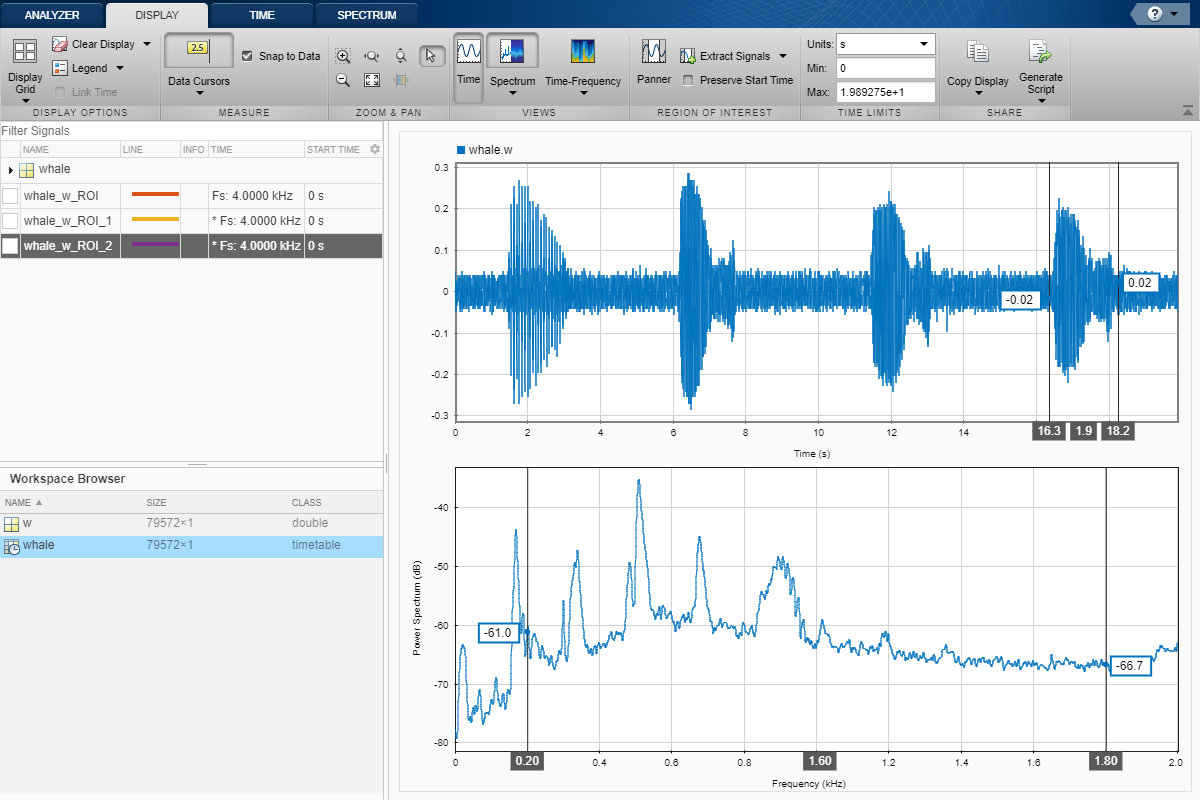
On theDisplaytab, clickSpectrumto open a spectrum view and click泛to activate the panner. Use the panner to create a zoom window with a width of about 2 seconds. Drag the zoom window so that it is centered on the trill. The spectrum shows a noticeable peak at around 900 Hz.

Extract the three moans to compare their spectra:
将Panner Zoom窗口中心在第一个呻吟处。频谱具有八个明确定义的峰,位于170 Hz的倍数非常接近。点击提取信号▼和选择
Between Time Limits。点击泛to hide the panner. Press the space bar to see the full signal. ClickZoom in Xand zoom in on a 2-second interval of the time view centered on the second moan. The spectrum again has peaks at multiples of 170 Hz. Click提取信号▼和选择
Between Time Limits。Press the space bar to see the full signal. ClickData Cursors▼和选择
Two。将时域光标放在第三呻吟周围的2秒间隔。同样,倍数为170Hz的峰值。点击提取信号▼和选择Between Time Cursors。
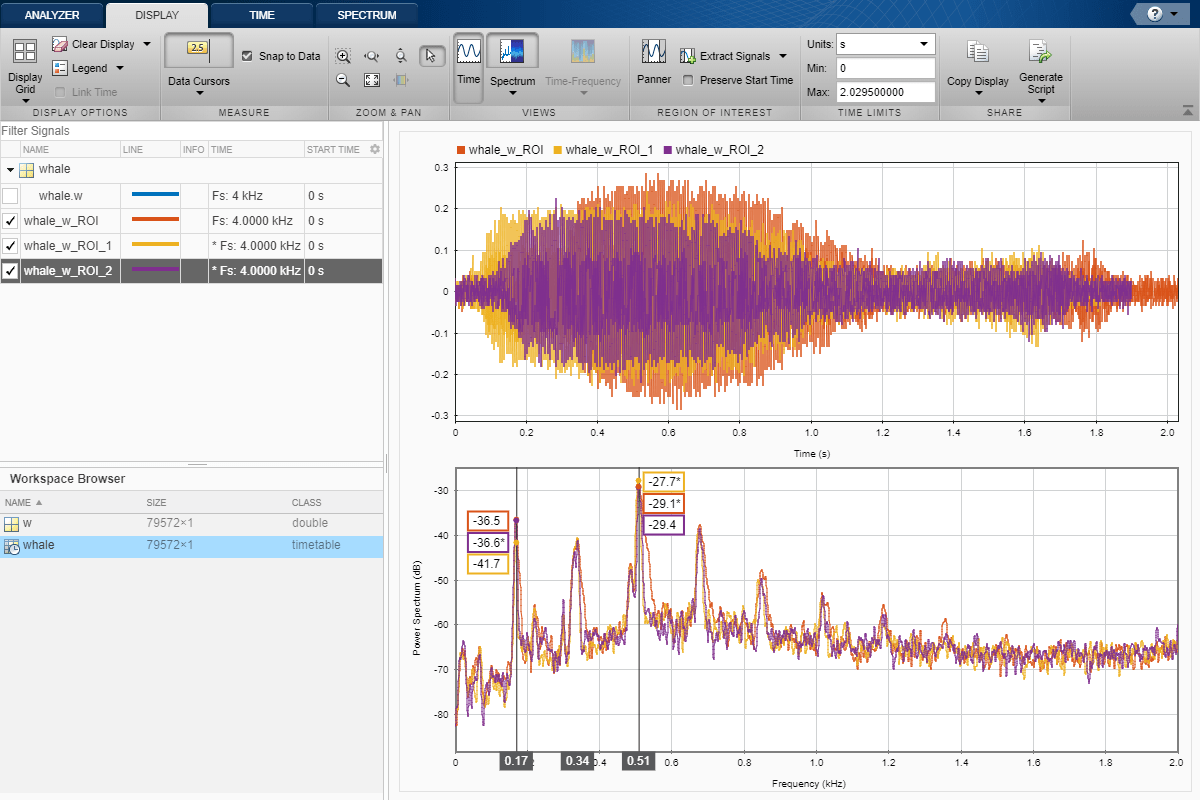
Remove the original signal from the display by clearing the check box next to its name in the Signal table. Display the three regions of interest you just extracted. Their spectra lie approximately on top of each other. Move the frequency-domain cursors to the locations of the first and third spectral peaks. Asterisks in cursor labels indicate interpolated signal values.
See Also
Apps
Functions
相关考试ples
- 在相关信号之间找到延迟
- Plot Signals from the Command Line
- Resolve Tones by Varying Window Leakage
- Analyze Signals with Inherent Time Information
- Spectrogram View of Dial Tone Signal
- Find Interference Using Persistence Spectrum
- Modulation and Demodulation Using Complex Envelope
- Find and Track Ridges Using Reassigned Spectrogram
- Scalogram of Hyperbolic Chirp
- 从音乐信号中提取声音
- 重新取样和过滤不均匀的采样信号
- 使用您自己的功能向饱和信号陈列
- Compute Envelope Spectrum of Vibration Signal
More About
Select a Web Site
Choose a web site to get translated content where available and see local events and offers. Based on your location, we recommend that you select:。
Selectweb siteYou can also select a web site from the following list:
Americas
- América拉丁(Español)
- Canada(English)
- United States(English)
欧洲
- Belgium(English)
- 丹麦(English)
- Deutschland(德意志)
- España(Español)
- Finland(English)
- 法国(Français)
- 爱尔兰(English)
- Italia(Italiano)
- Luxembourg(English)
- Netherlands(English)
- 挪威(English)
- Österreich(德意志)
- Portugal(English)
- Sweden(English)
- Switzerland
- United Kingdom(English)